Iraqi vs Immigrants from Guatemala Divorced or Separated
COMPARE
Iraqi
Immigrants from Guatemala
Divorced or Separated
Divorced or Separated Comparison
Iraqis
Immigrants from Guatemala
11.8%
DIVORCED OR SEPARATED
94.6/ 100
METRIC RATING
120th/ 347
METRIC RANK
12.2%
DIVORCED OR SEPARATED
23.2/ 100
METRIC RATING
203rd/ 347
METRIC RANK
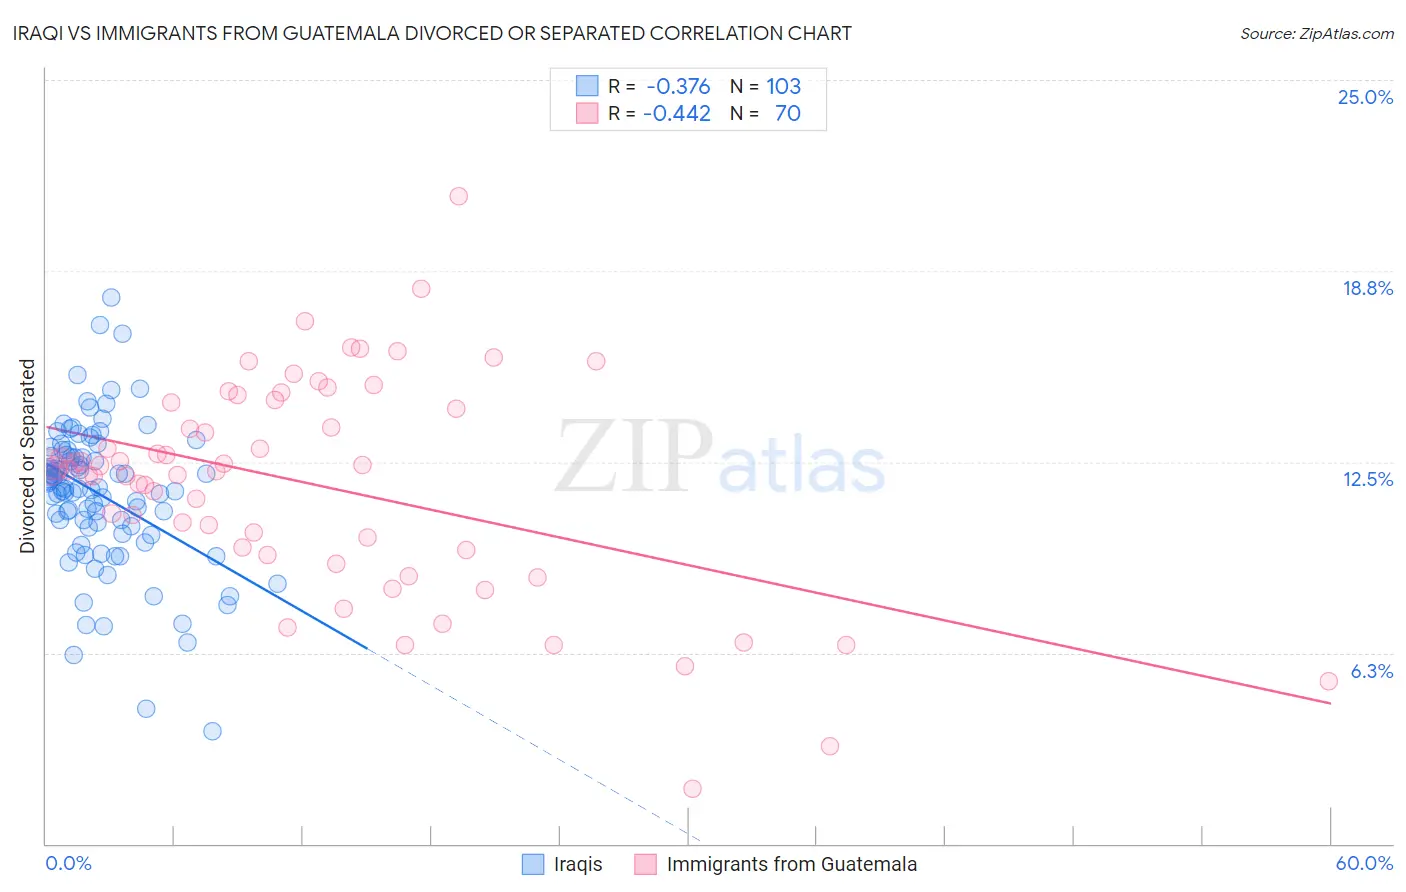
Iraqi vs Immigrants from Guatemala Divorced or Separated Correlation Chart
The statistical analysis conducted on geographies consisting of 170,608,468 people shows a mild negative correlation between the proportion of Iraqis and percentage of population currently divorced or separated in the United States with a correlation coefficient (R) of -0.376 and weighted average of 11.8%. Similarly, the statistical analysis conducted on geographies consisting of 377,229,357 people shows a moderate negative correlation between the proportion of Immigrants from Guatemala and percentage of population currently divorced or separated in the United States with a correlation coefficient (R) of -0.442 and weighted average of 12.2%, a difference of 3.6%.
Divorced or Separated Correlation Summary
| Measurement | Iraqi | Immigrants from Guatemala |
| Minimum | 3.7% | 1.8% |
| Maximum | 17.9% | 21.2% |
| Range | 14.2% | 19.4% |
| Mean | 11.4% | 11.7% |
| Median | 11.7% | 12.3% |
| Interquartile 25% (IQ1) | 10.4% | 9.6% |
| Interquartile 75% (IQ3) | 12.7% | 14.4% |
| Interquartile Range (IQR) | 2.4% | 4.8% |
| Standard Deviation (Sample) | 2.4% | 3.6% |
| Standard Deviation (Population) | 2.4% | 3.5% |
Similar Demographics by Divorced or Separated
Demographics Similar to Iraqis by Divorced or Separated
In terms of divorced or separated, the demographic groups most similar to Iraqis are Romanian (11.8%, a difference of 0.010%), Syrian (11.7%, a difference of 0.090%), Immigrants from Uganda (11.7%, a difference of 0.13%), Ecuadorian (11.7%, a difference of 0.13%), and Menominee (11.8%, a difference of 0.13%).
| Demographics | Rating | Rank | Divorced or Separated |
| Estonians | 96.6 /100 | #113 | Exceptional 11.7% |
| Immigrants | Norway | 95.9 /100 | #114 | Exceptional 11.7% |
| Lithuanians | 95.7 /100 | #115 | Exceptional 11.7% |
| Immigrants | Iraq | 95.4 /100 | #116 | Exceptional 11.7% |
| Immigrants | Uganda | 95.3 /100 | #117 | Exceptional 11.7% |
| Ecuadorians | 95.3 /100 | #118 | Exceptional 11.7% |
| Syrians | 95.1 /100 | #119 | Exceptional 11.7% |
| Iraqis | 94.6 /100 | #120 | Exceptional 11.8% |
| Romanians | 94.5 /100 | #121 | Exceptional 11.8% |
| Menominee | 93.8 /100 | #122 | Exceptional 11.8% |
| Immigrants | Immigrants | 93.7 /100 | #123 | Exceptional 11.8% |
| Ugandans | 93.1 /100 | #124 | Exceptional 11.8% |
| Ukrainians | 92.3 /100 | #125 | Exceptional 11.8% |
| South American Indians | 92.1 /100 | #126 | Exceptional 11.8% |
| South Africans | 88.9 /100 | #127 | Excellent 11.8% |
Demographics Similar to Immigrants from Guatemala by Divorced or Separated
In terms of divorced or separated, the demographic groups most similar to Immigrants from Guatemala are Portuguese (12.2%, a difference of 0.020%), Kenyan (12.2%, a difference of 0.070%), Immigrants from Costa Rica (12.2%, a difference of 0.10%), Slovak (12.2%, a difference of 0.11%), and Mexican (12.2%, a difference of 0.11%).
| Demographics | Rating | Rank | Divorced or Separated |
| Immigrants | Burma/Myanmar | 30.4 /100 | #196 | Fair 12.1% |
| Immigrants | Africa | 30.3 /100 | #197 | Fair 12.1% |
| Nigerians | 30.1 /100 | #198 | Fair 12.1% |
| Central Americans | 29.4 /100 | #199 | Fair 12.1% |
| South Americans | 28.6 /100 | #200 | Fair 12.2% |
| Guatemalans | 26.9 /100 | #201 | Fair 12.2% |
| Portuguese | 23.5 /100 | #202 | Fair 12.2% |
| Immigrants | Guatemala | 23.2 /100 | #203 | Fair 12.2% |
| Kenyans | 21.8 /100 | #204 | Fair 12.2% |
| Immigrants | Costa Rica | 21.3 /100 | #205 | Fair 12.2% |
| Slovaks | 21.0 /100 | #206 | Fair 12.2% |
| Mexicans | 21.0 /100 | #207 | Fair 12.2% |
| Immigrants | Ghana | 18.8 /100 | #208 | Poor 12.2% |
| Immigrants | Trinidad and Tobago | 17.8 /100 | #209 | Poor 12.2% |
| Slavs | 17.0 /100 | #210 | Poor 12.2% |