Swedish vs Trinidadian and Tobagonian Average Family Size
COMPARE
Swedish
Trinidadian and Tobagonian
Average Family Size
Average Family Size Comparison
Swedes
Trinidadians and Tobagonians
3.10
AVERAGE FAMILY SIZE
0.0/ 100
METRIC RATING
337th/ 347
METRIC RANK
3.32
AVERAGE FAMILY SIZE
99.8/ 100
METRIC RATING
76th/ 347
METRIC RANK
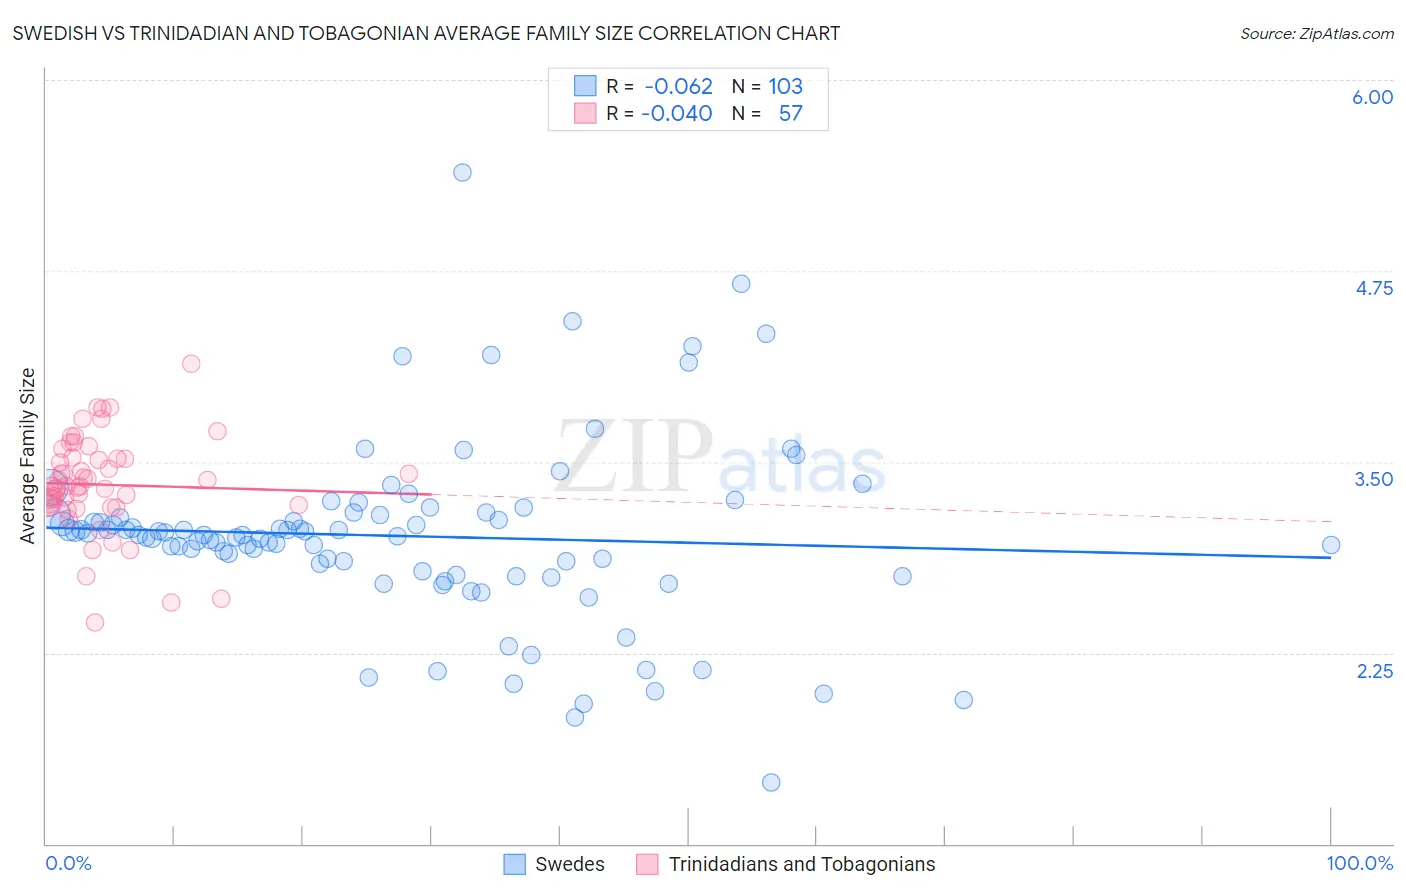
Swedish vs Trinidadian and Tobagonian Average Family Size Correlation Chart
The statistical analysis conducted on geographies consisting of 538,762,324 people shows a slight negative correlation between the proportion of Swedes and average family size in the United States with a correlation coefficient (R) of -0.062 and weighted average of 3.10. Similarly, the statistical analysis conducted on geographies consisting of 219,714,835 people shows no correlation between the proportion of Trinidadians and Tobagonians and average family size in the United States with a correlation coefficient (R) of -0.040 and weighted average of 3.32, a difference of 7.2%.
Average Family Size Correlation Summary
| Measurement | Swedish | Trinidadian and Tobagonian |
| Minimum | 1.40 | 2.45 |
| Maximum | 5.39 | 4.14 |
| Range | 3.99 | 1.69 |
| Mean | 3.01 | 3.35 |
| Median | 3.02 | 3.34 |
| Interquartile 25% (IQ1) | 2.79 | 3.22 |
| Interquartile 75% (IQ3) | 3.16 | 3.52 |
| Interquartile Range (IQR) | 0.37 | 0.31 |
| Standard Deviation (Sample) | 0.59 | 0.32 |
| Standard Deviation (Population) | 0.59 | 0.32 |
Similar Demographics by Average Family Size
Demographics Similar to Swedes by Average Family Size
In terms of average family size, the demographic groups most similar to Swedes are French (3.10, a difference of 0.020%), Irish (3.10, a difference of 0.030%), Croatian (3.10, a difference of 0.030%), Luxembourger (3.10, a difference of 0.090%), and Lithuanian (3.10, a difference of 0.12%).
| Demographics | Rating | Rank | Average Family Size |
| Latvians | 0.0 /100 | #330 | Tragic 3.11 |
| Scotch-Irish | 0.0 /100 | #331 | Tragic 3.11 |
| Scottish | 0.0 /100 | #332 | Tragic 3.11 |
| Estonians | 0.0 /100 | #333 | Tragic 3.10 |
| Lithuanians | 0.0 /100 | #334 | Tragic 3.10 |
| Luxembourgers | 0.0 /100 | #335 | Tragic 3.10 |
| Irish | 0.0 /100 | #336 | Tragic 3.10 |
| Swedes | 0.0 /100 | #337 | Tragic 3.10 |
| French | 0.0 /100 | #338 | Tragic 3.10 |
| Croatians | 0.0 /100 | #339 | Tragic 3.10 |
| Finns | 0.0 /100 | #340 | Tragic 3.09 |
| Poles | 0.0 /100 | #341 | Tragic 3.09 |
| Germans | 0.0 /100 | #342 | Tragic 3.09 |
| Norwegians | 0.0 /100 | #343 | Tragic 3.08 |
| French Canadians | 0.0 /100 | #344 | Tragic 3.07 |
Demographics Similar to Trinidadians and Tobagonians by Average Family Size
In terms of average family size, the demographic groups most similar to Trinidadians and Tobagonians are Immigrants from Ecuador (3.32, a difference of 0.010%), Immigrants from Barbados (3.32, a difference of 0.020%), Immigrants from Sierra Leone (3.32, a difference of 0.050%), Immigrants from Micronesia (3.32, a difference of 0.050%), and British West Indian (3.32, a difference of 0.060%).
| Demographics | Rating | Rank | Average Family Size |
| Immigrants | Immigrants | 99.9 /100 | #69 | Exceptional 3.33 |
| Immigrants | Trinidad and Tobago | 99.9 /100 | #70 | Exceptional 3.33 |
| Immigrants | West Indies | 99.9 /100 | #71 | Exceptional 3.33 |
| Immigrants | Caribbean | 99.9 /100 | #72 | Exceptional 3.33 |
| Yaqui | 99.9 /100 | #73 | Exceptional 3.32 |
| Immigrants | Sierra Leone | 99.9 /100 | #74 | Exceptional 3.32 |
| Immigrants | Barbados | 99.8 /100 | #75 | Exceptional 3.32 |
| Trinidadians and Tobagonians | 99.8 /100 | #76 | Exceptional 3.32 |
| Immigrants | Ecuador | 99.8 /100 | #77 | Exceptional 3.32 |
| Immigrants | Micronesia | 99.8 /100 | #78 | Exceptional 3.32 |
| British West Indians | 99.8 /100 | #79 | Exceptional 3.32 |
| Lumbee | 99.8 /100 | #80 | Exceptional 3.32 |
| Immigrants | Dominica | 99.8 /100 | #81 | Exceptional 3.32 |
| Ecuadorians | 99.8 /100 | #82 | Exceptional 3.32 |
| Immigrants | Afghanistan | 99.8 /100 | #83 | Exceptional 3.32 |