Swedish vs Dutch West Indian Divorced or Separated
COMPARE
Swedish
Dutch West Indian
Divorced or Separated
Divorced or Separated Comparison
Swedes
Dutch West Indians
12.1%
DIVORCED OR SEPARATED
34.4/ 100
METRIC RATING
191st/ 347
METRIC RANK
14.0%
DIVORCED OR SEPARATED
0.0/ 100
METRIC RATING
335th/ 347
METRIC RANK
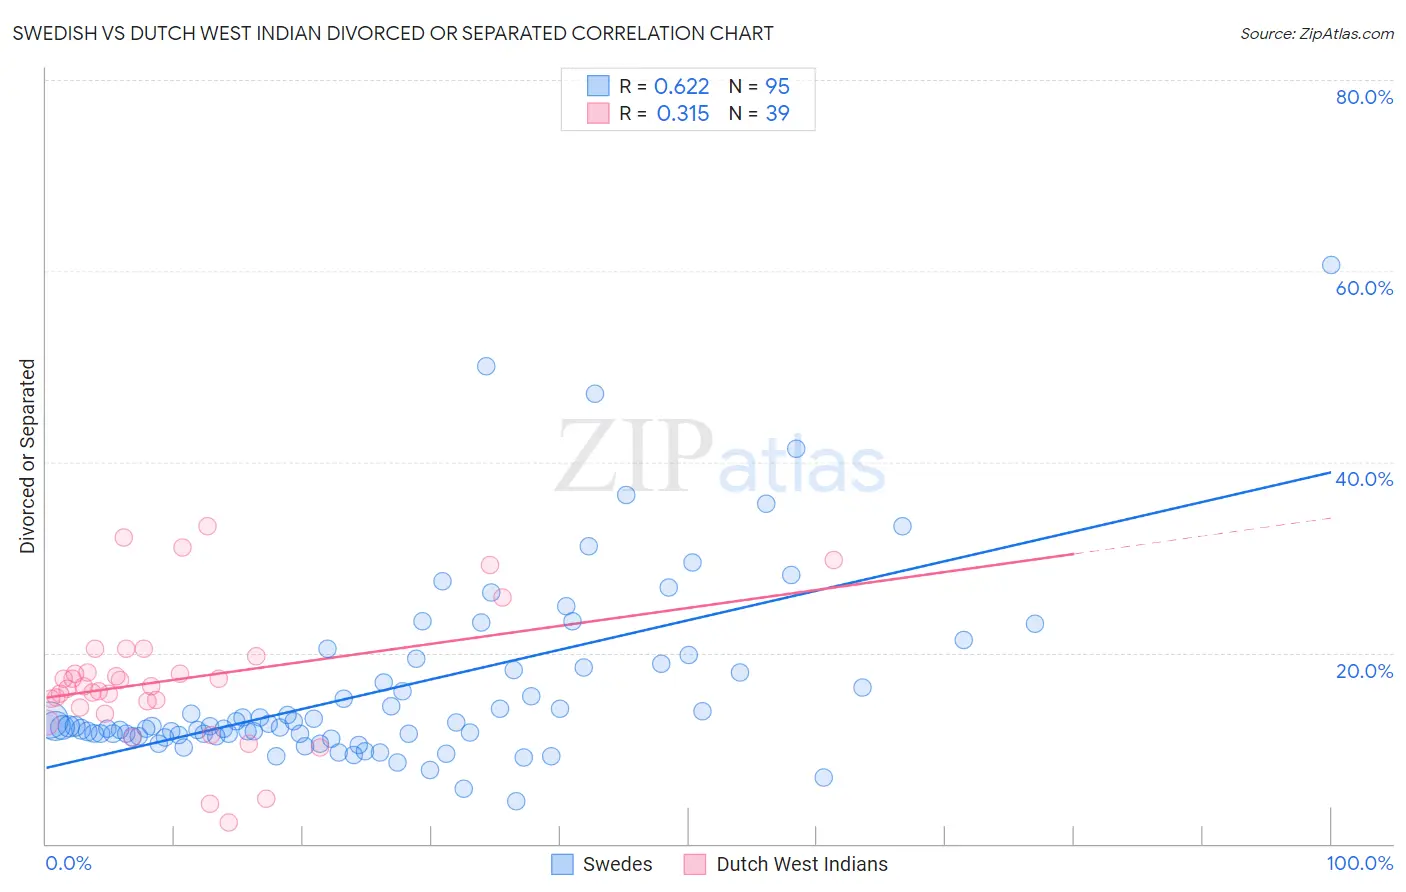
Swedish vs Dutch West Indian Divorced or Separated Correlation Chart
The statistical analysis conducted on geographies consisting of 538,888,854 people shows a significant positive correlation between the proportion of Swedes and percentage of population currently divorced or separated in the United States with a correlation coefficient (R) of 0.622 and weighted average of 12.1%. Similarly, the statistical analysis conducted on geographies consisting of 85,774,203 people shows a mild positive correlation between the proportion of Dutch West Indians and percentage of population currently divorced or separated in the United States with a correlation coefficient (R) of 0.315 and weighted average of 14.0%, a difference of 15.4%.
Divorced or Separated Correlation Summary
| Measurement | Swedish | Dutch West Indian |
| Minimum | 4.5% | 2.2% |
| Maximum | 60.6% | 33.3% |
| Range | 56.1% | 31.1% |
| Mean | 16.3% | 17.2% |
| Median | 12.3% | 16.5% |
| Interquartile 25% (IQ1) | 11.4% | 14.3% |
| Interquartile 75% (IQ3) | 18.5% | 19.6% |
| Interquartile Range (IQR) | 7.2% | 5.3% |
| Standard Deviation (Sample) | 9.7% | 7.0% |
| Standard Deviation (Population) | 9.6% | 6.9% |
Similar Demographics by Divorced or Separated
Demographics Similar to Swedes by Divorced or Separated
In terms of divorced or separated, the demographic groups most similar to Swedes are Moroccan (12.1%, a difference of 0.020%), Sierra Leonean (12.1%, a difference of 0.040%), Norwegian (12.1%, a difference of 0.050%), Immigrants from Thailand (12.1%, a difference of 0.070%), and Immigrants from Eritrea (12.1%, a difference of 0.10%).
| Demographics | Rating | Rank | Divorced or Separated |
| Immigrants | North America | 41.1 /100 | #184 | Average 12.1% |
| Immigrants | Nigeria | 40.5 /100 | #185 | Average 12.1% |
| Immigrants | Chile | 39.0 /100 | #186 | Fair 12.1% |
| Belizeans | 37.7 /100 | #187 | Fair 12.1% |
| Immigrants | Belize | 37.6 /100 | #188 | Fair 12.1% |
| Sierra Leoneans | 35.5 /100 | #189 | Fair 12.1% |
| Moroccans | 34.8 /100 | #190 | Fair 12.1% |
| Swedes | 34.4 /100 | #191 | Fair 12.1% |
| Norwegians | 33.2 /100 | #192 | Fair 12.1% |
| Immigrants | Thailand | 32.5 /100 | #193 | Fair 12.1% |
| Immigrants | Eritrea | 31.9 /100 | #194 | Fair 12.1% |
| Immigrants | England | 31.4 /100 | #195 | Fair 12.1% |
| Immigrants | Burma/Myanmar | 30.4 /100 | #196 | Fair 12.1% |
| Immigrants | Africa | 30.3 /100 | #197 | Fair 12.1% |
| Nigerians | 30.1 /100 | #198 | Fair 12.1% |
Demographics Similar to Dutch West Indians by Divorced or Separated
In terms of divorced or separated, the demographic groups most similar to Dutch West Indians are Shoshone (14.0%, a difference of 0.34%), Immigrants from Bahamas (13.9%, a difference of 0.60%), Crow (14.1%, a difference of 0.63%), Choctaw (14.1%, a difference of 0.94%), and Puerto Rican (13.9%, a difference of 0.95%).
| Demographics | Rating | Rank | Divorced or Separated |
| Immigrants | Caribbean | 0.0 /100 | #328 | Tragic 13.6% |
| Houma | 0.0 /100 | #329 | Tragic 13.6% |
| Paiute | 0.0 /100 | #330 | Tragic 13.6% |
| Blacks/African Americans | 0.0 /100 | #331 | Tragic 13.6% |
| Cherokee | 0.0 /100 | #332 | Tragic 13.7% |
| Puerto Ricans | 0.0 /100 | #333 | Tragic 13.9% |
| Immigrants | Bahamas | 0.0 /100 | #334 | Tragic 13.9% |
| Dutch West Indians | 0.0 /100 | #335 | Tragic 14.0% |
| Shoshone | 0.0 /100 | #336 | Tragic 14.0% |
| Crow | 0.0 /100 | #337 | Tragic 14.1% |
| Choctaw | 0.0 /100 | #338 | Tragic 14.1% |
| Colville | 0.0 /100 | #339 | Tragic 14.2% |
| Chickasaw | 0.0 /100 | #340 | Tragic 14.2% |
| Bahamians | 0.0 /100 | #341 | Tragic 14.2% |
| Seminole | 0.0 /100 | #342 | Tragic 14.3% |