Swedish vs Alsatian Divorced or Separated
COMPARE
Swedish
Alsatian
Divorced or Separated
Divorced or Separated Comparison
Swedes
Alsatians
12.1%
DIVORCED OR SEPARATED
34.4/ 100
METRIC RATING
191st/ 347
METRIC RANK
11.9%
DIVORCED OR SEPARATED
84.0/ 100
METRIC RATING
137th/ 347
METRIC RANK
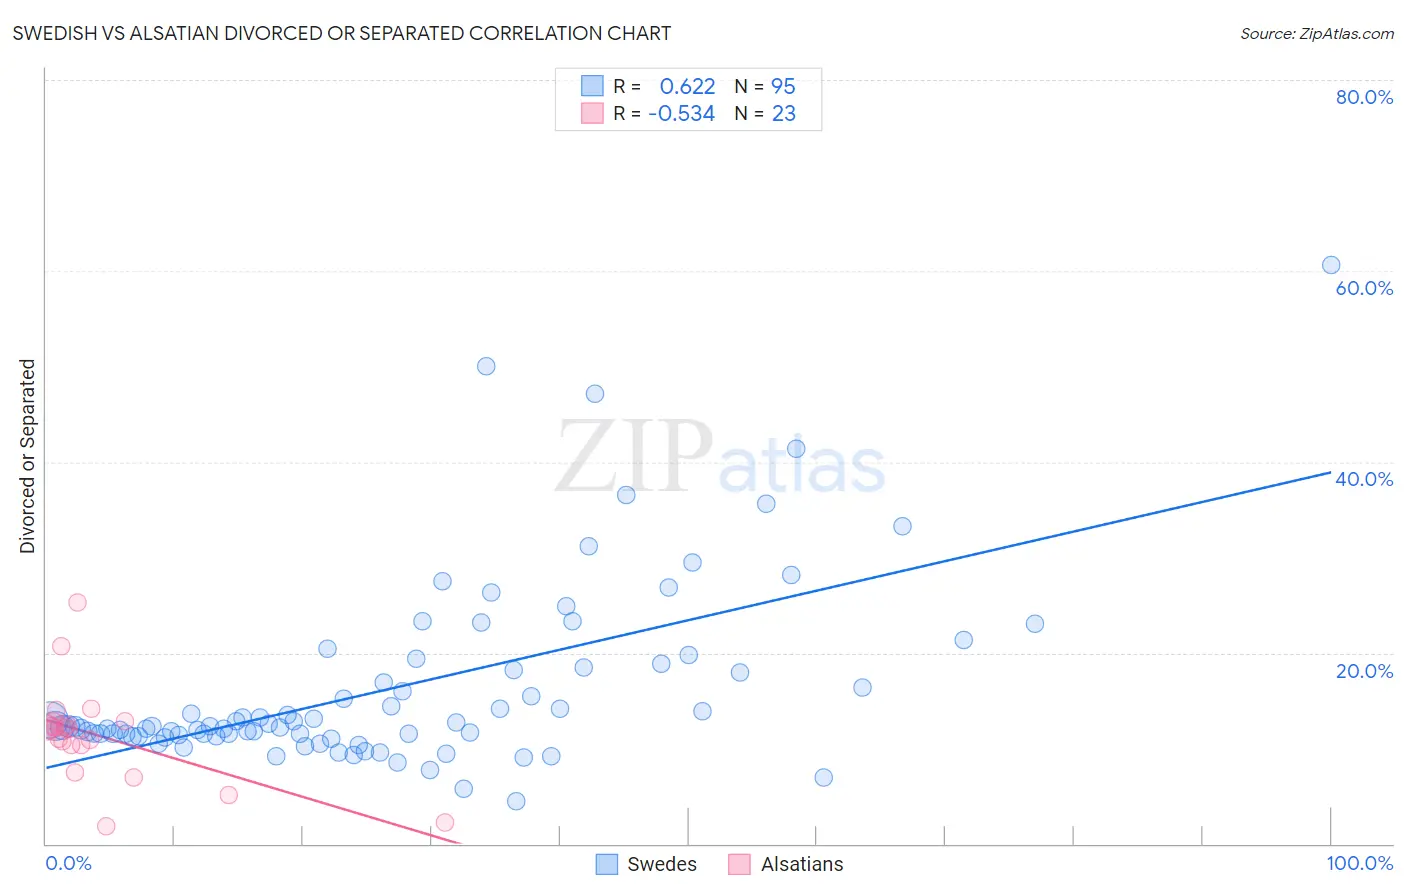
Swedish vs Alsatian Divorced or Separated Correlation Chart
The statistical analysis conducted on geographies consisting of 538,888,854 people shows a significant positive correlation between the proportion of Swedes and percentage of population currently divorced or separated in the United States with a correlation coefficient (R) of 0.622 and weighted average of 12.1%. Similarly, the statistical analysis conducted on geographies consisting of 82,679,832 people shows a substantial negative correlation between the proportion of Alsatians and percentage of population currently divorced or separated in the United States with a correlation coefficient (R) of -0.534 and weighted average of 11.9%, a difference of 2.0%.
Divorced or Separated Correlation Summary
| Measurement | Swedish | Alsatian |
| Minimum | 4.5% | 1.8% |
| Maximum | 60.6% | 25.3% |
| Range | 56.1% | 23.5% |
| Mean | 16.3% | 11.4% |
| Median | 12.3% | 12.1% |
| Interquartile 25% (IQ1) | 11.4% | 10.4% |
| Interquartile 75% (IQ3) | 18.5% | 12.8% |
| Interquartile Range (IQR) | 7.2% | 2.4% |
| Standard Deviation (Sample) | 9.7% | 5.0% |
| Standard Deviation (Population) | 9.6% | 4.9% |
Similar Demographics by Divorced or Separated
Demographics Similar to Swedes by Divorced or Separated
In terms of divorced or separated, the demographic groups most similar to Swedes are Moroccan (12.1%, a difference of 0.020%), Sierra Leonean (12.1%, a difference of 0.040%), Norwegian (12.1%, a difference of 0.050%), Immigrants from Thailand (12.1%, a difference of 0.070%), and Immigrants from Eritrea (12.1%, a difference of 0.10%).
| Demographics | Rating | Rank | Divorced or Separated |
| Immigrants | North America | 41.1 /100 | #184 | Average 12.1% |
| Immigrants | Nigeria | 40.5 /100 | #185 | Average 12.1% |
| Immigrants | Chile | 39.0 /100 | #186 | Fair 12.1% |
| Belizeans | 37.7 /100 | #187 | Fair 12.1% |
| Immigrants | Belize | 37.6 /100 | #188 | Fair 12.1% |
| Sierra Leoneans | 35.5 /100 | #189 | Fair 12.1% |
| Moroccans | 34.8 /100 | #190 | Fair 12.1% |
| Swedes | 34.4 /100 | #191 | Fair 12.1% |
| Norwegians | 33.2 /100 | #192 | Fair 12.1% |
| Immigrants | Thailand | 32.5 /100 | #193 | Fair 12.1% |
| Immigrants | Eritrea | 31.9 /100 | #194 | Fair 12.1% |
| Immigrants | England | 31.4 /100 | #195 | Fair 12.1% |
| Immigrants | Burma/Myanmar | 30.4 /100 | #196 | Fair 12.1% |
| Immigrants | Africa | 30.3 /100 | #197 | Fair 12.1% |
| Nigerians | 30.1 /100 | #198 | Fair 12.1% |
Demographics Similar to Alsatians by Divorced or Separated
In terms of divorced or separated, the demographic groups most similar to Alsatians are Immigrants from Netherlands (11.9%, a difference of 0.0%), Australian (11.9%, a difference of 0.020%), Lebanese (11.9%, a difference of 0.040%), Danish (11.9%, a difference of 0.060%), and Carpatho Rusyn (11.9%, a difference of 0.060%).
| Demographics | Rating | Rank | Divorced or Separated |
| Immigrants | Austria | 88.2 /100 | #130 | Excellent 11.8% |
| Immigrants | Cambodia | 88.2 /100 | #131 | Excellent 11.8% |
| Immigrants | Afghanistan | 87.9 /100 | #132 | Excellent 11.8% |
| New Zealanders | 87.5 /100 | #133 | Excellent 11.9% |
| Argentineans | 85.1 /100 | #134 | Excellent 11.9% |
| Danes | 84.8 /100 | #135 | Excellent 11.9% |
| Carpatho Rusyns | 84.8 /100 | #136 | Excellent 11.9% |
| Alsatians | 84.0 /100 | #137 | Excellent 11.9% |
| Immigrants | Netherlands | 83.9 /100 | #138 | Excellent 11.9% |
| Australians | 83.6 /100 | #139 | Excellent 11.9% |
| Lebanese | 83.4 /100 | #140 | Excellent 11.9% |
| Immigrants | Morocco | 82.9 /100 | #141 | Excellent 11.9% |
| Immigrants | Zimbabwe | 81.5 /100 | #142 | Excellent 11.9% |
| Pakistanis | 81.3 /100 | #143 | Excellent 11.9% |
| Peruvians | 80.9 /100 | #144 | Excellent 11.9% |