Barbadian vs Alsatian Divorced or Separated
COMPARE
Barbadian
Alsatian
Divorced or Separated
Divorced or Separated Comparison
Barbadians
Alsatians
12.1%
DIVORCED OR SEPARATED
45.0/ 100
METRIC RATING
180th/ 347
METRIC RANK
11.9%
DIVORCED OR SEPARATED
84.0/ 100
METRIC RATING
137th/ 347
METRIC RANK
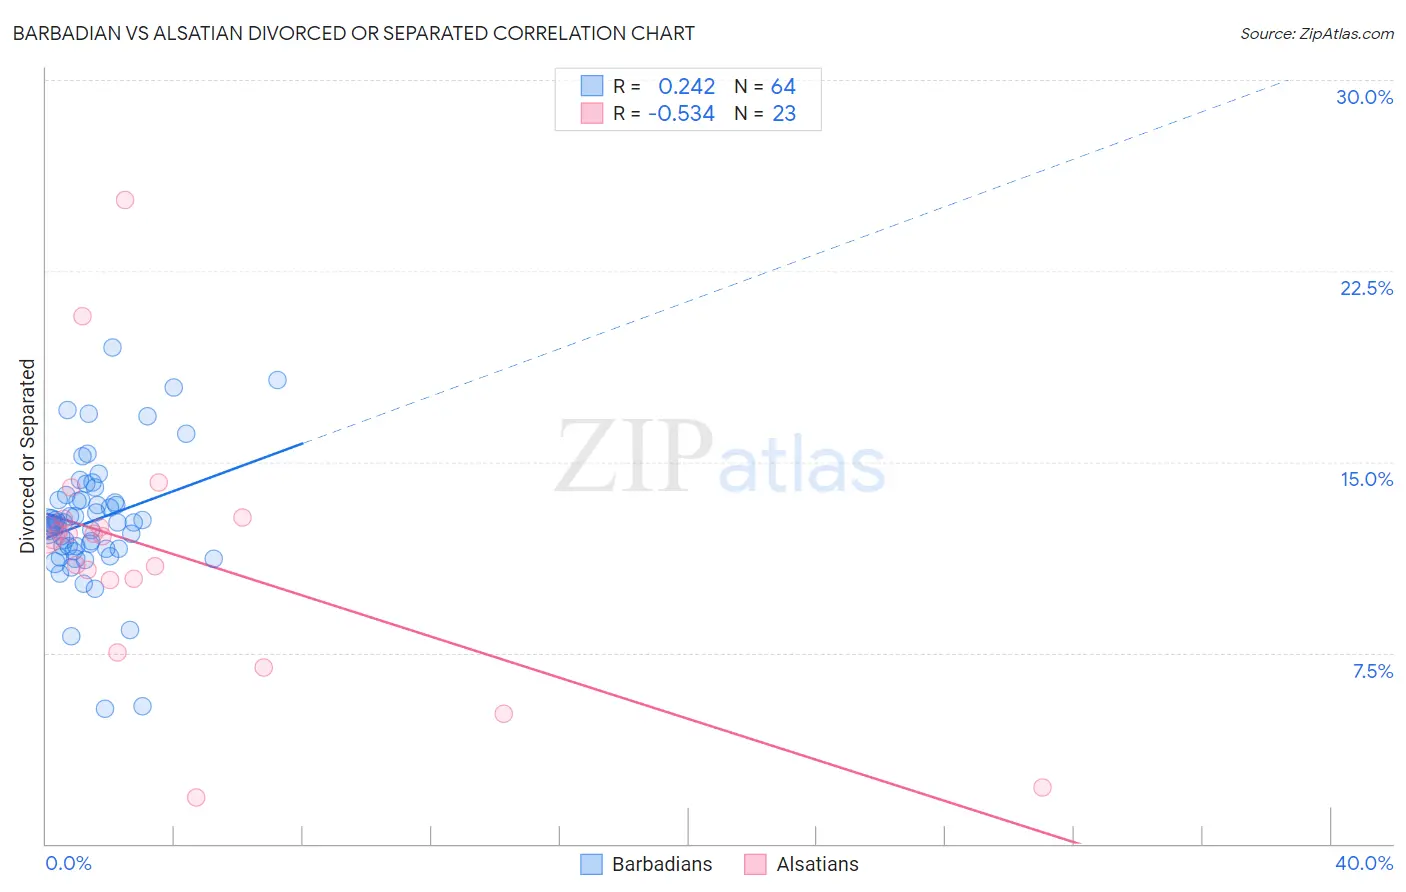
Barbadian vs Alsatian Divorced or Separated Correlation Chart
The statistical analysis conducted on geographies consisting of 141,266,307 people shows a weak positive correlation between the proportion of Barbadians and percentage of population currently divorced or separated in the United States with a correlation coefficient (R) of 0.242 and weighted average of 12.1%. Similarly, the statistical analysis conducted on geographies consisting of 82,679,832 people shows a substantial negative correlation between the proportion of Alsatians and percentage of population currently divorced or separated in the United States with a correlation coefficient (R) of -0.534 and weighted average of 11.9%, a difference of 1.6%.
Divorced or Separated Correlation Summary
| Measurement | Barbadian | Alsatian |
| Minimum | 5.3% | 1.8% |
| Maximum | 19.5% | 25.3% |
| Range | 14.2% | 23.5% |
| Mean | 12.7% | 11.4% |
| Median | 12.6% | 12.1% |
| Interquartile 25% (IQ1) | 11.6% | 10.4% |
| Interquartile 75% (IQ3) | 13.5% | 12.8% |
| Interquartile Range (IQR) | 1.9% | 2.4% |
| Standard Deviation (Sample) | 2.5% | 5.0% |
| Standard Deviation (Population) | 2.5% | 4.9% |
Similar Demographics by Divorced or Separated
Demographics Similar to Barbadians by Divorced or Separated
In terms of divorced or separated, the demographic groups most similar to Barbadians are Immigrants from Western Europe (12.1%, a difference of 0.020%), Ghanaian (12.1%, a difference of 0.030%), Immigrants from Canada (12.1%, a difference of 0.030%), Immigrants from Ethiopia (12.1%, a difference of 0.070%), and Immigrants from Central America (12.1%, a difference of 0.070%).
| Demographics | Rating | Rank | Divorced or Separated |
| Immigrants | Moldova | 50.4 /100 | #173 | Average 12.1% |
| Hawaiians | 50.0 /100 | #174 | Average 12.1% |
| Immigrants | Sierra Leone | 50.0 /100 | #175 | Average 12.1% |
| Pennsylvania Germans | 48.9 /100 | #176 | Average 12.1% |
| Brazilians | 47.7 /100 | #177 | Average 12.1% |
| Ghanaians | 45.9 /100 | #178 | Average 12.1% |
| Immigrants | Western Europe | 45.6 /100 | #179 | Average 12.1% |
| Barbadians | 45.0 /100 | #180 | Average 12.1% |
| Immigrants | Canada | 44.0 /100 | #181 | Average 12.1% |
| Immigrants | Ethiopia | 43.1 /100 | #182 | Average 12.1% |
| Immigrants | Central America | 42.9 /100 | #183 | Average 12.1% |
| Immigrants | North America | 41.1 /100 | #184 | Average 12.1% |
| Immigrants | Nigeria | 40.5 /100 | #185 | Average 12.1% |
| Immigrants | Chile | 39.0 /100 | #186 | Fair 12.1% |
| Belizeans | 37.7 /100 | #187 | Fair 12.1% |
Demographics Similar to Alsatians by Divorced or Separated
In terms of divorced or separated, the demographic groups most similar to Alsatians are Immigrants from Netherlands (11.9%, a difference of 0.0%), Australian (11.9%, a difference of 0.020%), Lebanese (11.9%, a difference of 0.040%), Danish (11.9%, a difference of 0.060%), and Carpatho Rusyn (11.9%, a difference of 0.060%).
| Demographics | Rating | Rank | Divorced or Separated |
| Immigrants | Austria | 88.2 /100 | #130 | Excellent 11.8% |
| Immigrants | Cambodia | 88.2 /100 | #131 | Excellent 11.8% |
| Immigrants | Afghanistan | 87.9 /100 | #132 | Excellent 11.8% |
| New Zealanders | 87.5 /100 | #133 | Excellent 11.9% |
| Argentineans | 85.1 /100 | #134 | Excellent 11.9% |
| Danes | 84.8 /100 | #135 | Excellent 11.9% |
| Carpatho Rusyns | 84.8 /100 | #136 | Excellent 11.9% |
| Alsatians | 84.0 /100 | #137 | Excellent 11.9% |
| Immigrants | Netherlands | 83.9 /100 | #138 | Excellent 11.9% |
| Australians | 83.6 /100 | #139 | Excellent 11.9% |
| Lebanese | 83.4 /100 | #140 | Excellent 11.9% |
| Immigrants | Morocco | 82.9 /100 | #141 | Excellent 11.9% |
| Immigrants | Zimbabwe | 81.5 /100 | #142 | Excellent 11.9% |
| Pakistanis | 81.3 /100 | #143 | Excellent 11.9% |
| Peruvians | 80.9 /100 | #144 | Excellent 11.9% |