Immigrants from Argentina vs Alsatian Divorced or Separated
COMPARE
Immigrants from Argentina
Alsatian
Divorced or Separated
Divorced or Separated Comparison
Immigrants from Argentina
Alsatians
12.2%
DIVORCED OR SEPARATED
15.5/ 100
METRIC RATING
214th/ 347
METRIC RANK
11.9%
DIVORCED OR SEPARATED
84.0/ 100
METRIC RATING
137th/ 347
METRIC RANK
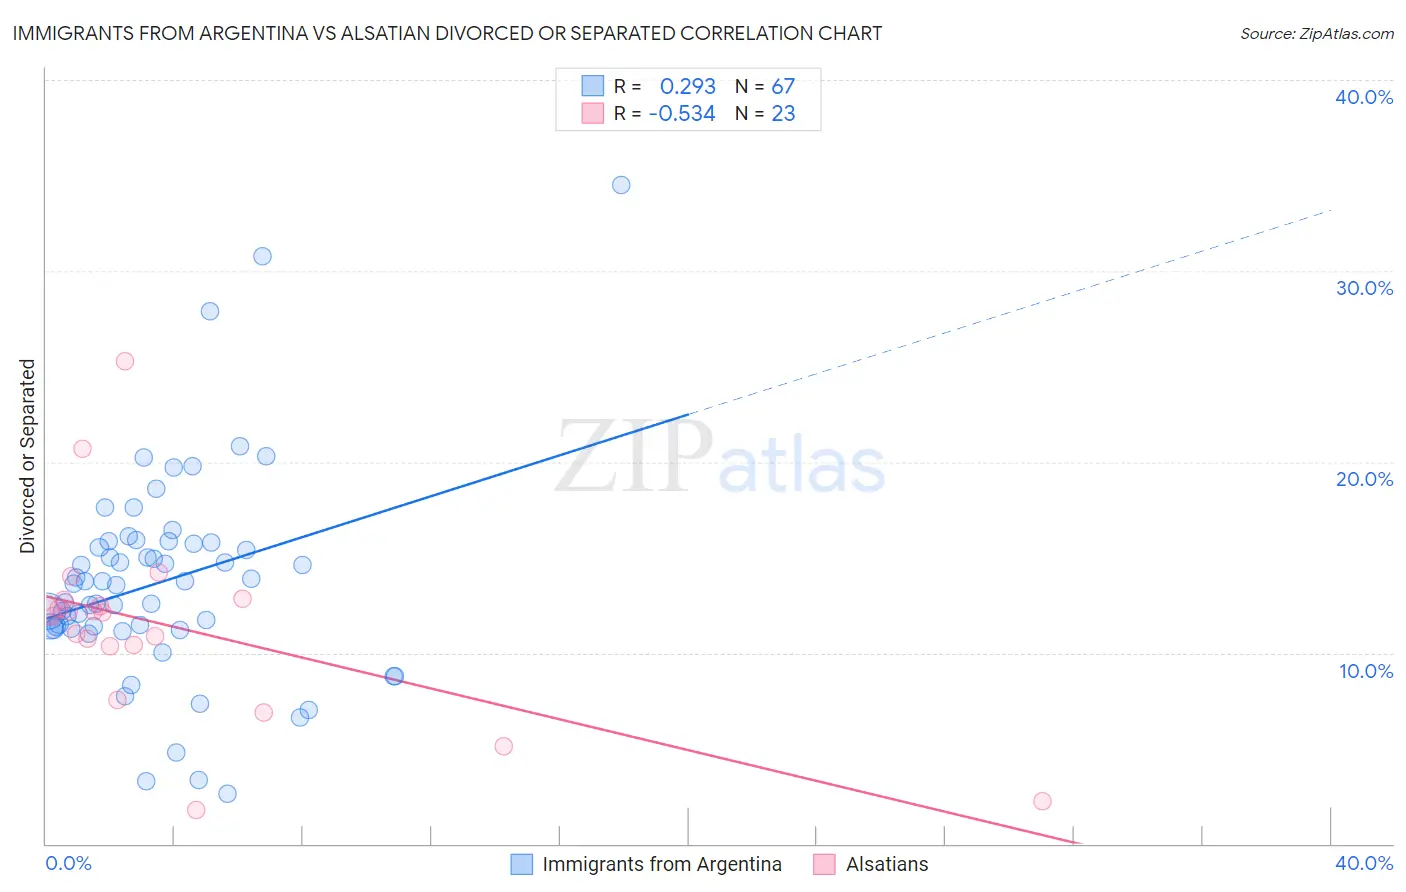
Immigrants from Argentina vs Alsatian Divorced or Separated Correlation Chart
The statistical analysis conducted on geographies consisting of 264,380,212 people shows a weak positive correlation between the proportion of Immigrants from Argentina and percentage of population currently divorced or separated in the United States with a correlation coefficient (R) of 0.293 and weighted average of 12.2%. Similarly, the statistical analysis conducted on geographies consisting of 82,679,832 people shows a substantial negative correlation between the proportion of Alsatians and percentage of population currently divorced or separated in the United States with a correlation coefficient (R) of -0.534 and weighted average of 11.9%, a difference of 2.9%.
Divorced or Separated Correlation Summary
| Measurement | Immigrants from Argentina | Alsatian |
| Minimum | 2.6% | 1.8% |
| Maximum | 34.5% | 25.3% |
| Range | 31.9% | 23.5% |
| Mean | 13.7% | 11.4% |
| Median | 13.6% | 12.1% |
| Interquartile 25% (IQ1) | 11.3% | 10.4% |
| Interquartile 75% (IQ3) | 15.8% | 12.8% |
| Interquartile Range (IQR) | 4.5% | 2.4% |
| Standard Deviation (Sample) | 5.5% | 5.0% |
| Standard Deviation (Population) | 5.5% | 4.9% |
Similar Demographics by Divorced or Separated
Demographics Similar to Immigrants from Argentina by Divorced or Separated
In terms of divorced or separated, the demographic groups most similar to Immigrants from Argentina are European (12.2%, a difference of 0.010%), Immigrants from South America (12.2%, a difference of 0.010%), Immigrants from Eastern Africa (12.2%, a difference of 0.050%), Northern European (12.2%, a difference of 0.050%), and Immigrants from Kenya (12.2%, a difference of 0.060%).
| Demographics | Rating | Rank | Divorced or Separated |
| Mexicans | 21.0 /100 | #207 | Fair 12.2% |
| Immigrants | Ghana | 18.8 /100 | #208 | Poor 12.2% |
| Immigrants | Trinidad and Tobago | 17.8 /100 | #209 | Poor 12.2% |
| Slavs | 17.0 /100 | #210 | Poor 12.2% |
| Trinidadians and Tobagonians | 16.6 /100 | #211 | Poor 12.2% |
| Immigrants | Kenya | 16.5 /100 | #212 | Poor 12.2% |
| Immigrants | Eastern Africa | 16.2 /100 | #213 | Poor 12.2% |
| Immigrants | Argentina | 15.5 /100 | #214 | Poor 12.2% |
| Europeans | 15.4 /100 | #215 | Poor 12.2% |
| Immigrants | South America | 15.4 /100 | #216 | Poor 12.2% |
| Northern Europeans | 14.7 /100 | #217 | Poor 12.2% |
| Slovenes | 13.2 /100 | #218 | Poor 12.3% |
| Czechoslovakians | 11.7 /100 | #219 | Poor 12.3% |
| British | 11.6 /100 | #220 | Poor 12.3% |
| Guamanians/Chamorros | 11.3 /100 | #221 | Poor 12.3% |
Demographics Similar to Alsatians by Divorced or Separated
In terms of divorced or separated, the demographic groups most similar to Alsatians are Immigrants from Netherlands (11.9%, a difference of 0.0%), Australian (11.9%, a difference of 0.020%), Lebanese (11.9%, a difference of 0.040%), Danish (11.9%, a difference of 0.060%), and Carpatho Rusyn (11.9%, a difference of 0.060%).
| Demographics | Rating | Rank | Divorced or Separated |
| Immigrants | Austria | 88.2 /100 | #130 | Excellent 11.8% |
| Immigrants | Cambodia | 88.2 /100 | #131 | Excellent 11.8% |
| Immigrants | Afghanistan | 87.9 /100 | #132 | Excellent 11.8% |
| New Zealanders | 87.5 /100 | #133 | Excellent 11.9% |
| Argentineans | 85.1 /100 | #134 | Excellent 11.9% |
| Danes | 84.8 /100 | #135 | Excellent 11.9% |
| Carpatho Rusyns | 84.8 /100 | #136 | Excellent 11.9% |
| Alsatians | 84.0 /100 | #137 | Excellent 11.9% |
| Immigrants | Netherlands | 83.9 /100 | #138 | Excellent 11.9% |
| Australians | 83.6 /100 | #139 | Excellent 11.9% |
| Lebanese | 83.4 /100 | #140 | Excellent 11.9% |
| Immigrants | Morocco | 82.9 /100 | #141 | Excellent 11.9% |
| Immigrants | Zimbabwe | 81.5 /100 | #142 | Excellent 11.9% |
| Pakistanis | 81.3 /100 | #143 | Excellent 11.9% |
| Peruvians | 80.9 /100 | #144 | Excellent 11.9% |