Immigrants from Iran vs Alsatian Divorced or Separated
COMPARE
Immigrants from Iran
Alsatian
Divorced or Separated
Divorced or Separated Comparison
Immigrants from Iran
Alsatians
10.6%
DIVORCED OR SEPARATED
100.0/ 100
METRIC RATING
18th/ 347
METRIC RANK
11.9%
DIVORCED OR SEPARATED
84.0/ 100
METRIC RATING
137th/ 347
METRIC RANK
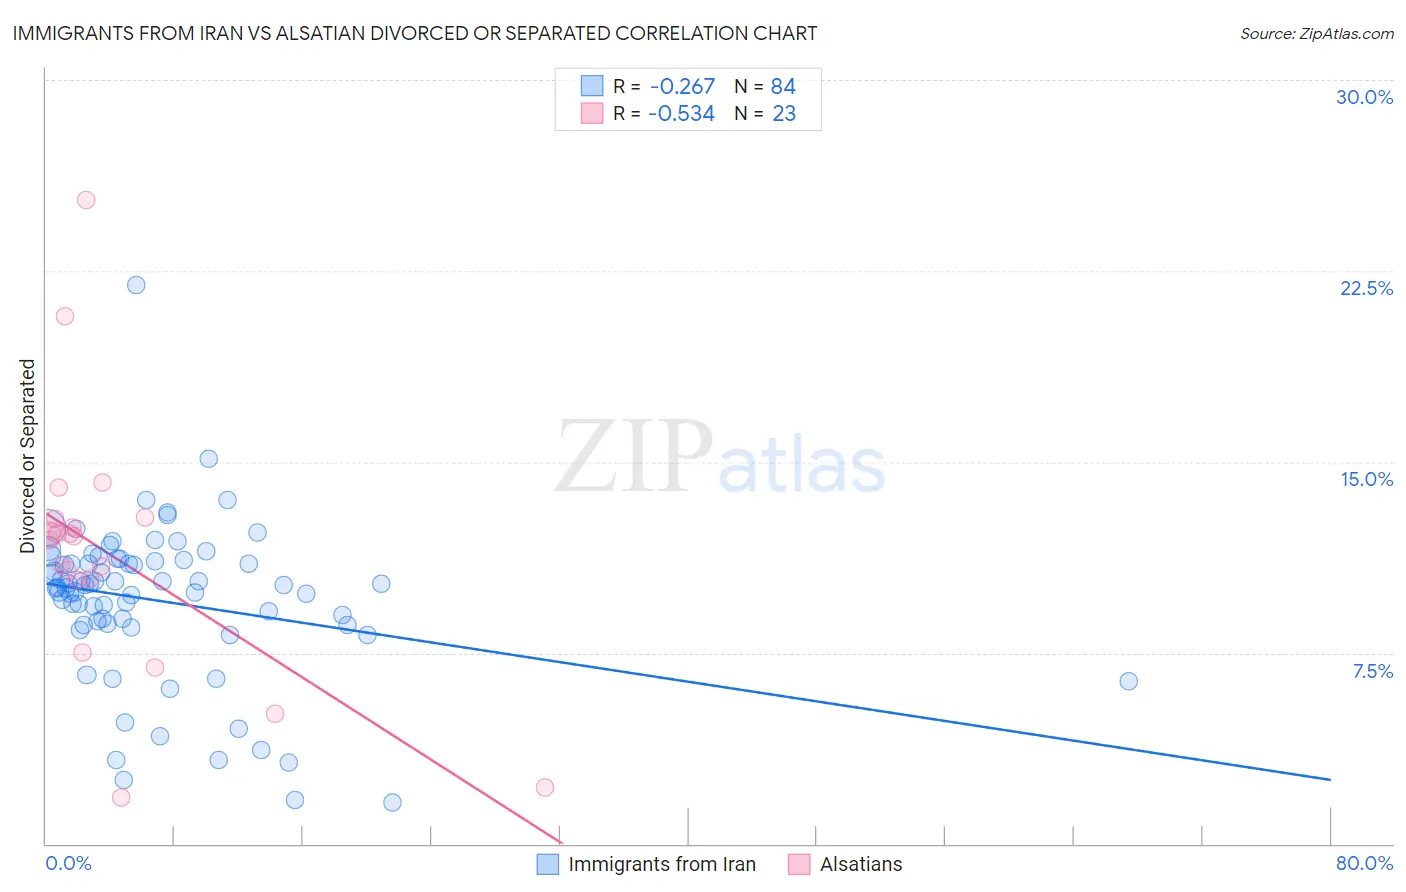
Immigrants from Iran vs Alsatian Divorced or Separated Correlation Chart
The statistical analysis conducted on geographies consisting of 279,868,346 people shows a weak negative correlation between the proportion of Immigrants from Iran and percentage of population currently divorced or separated in the United States with a correlation coefficient (R) of -0.267 and weighted average of 10.6%. Similarly, the statistical analysis conducted on geographies consisting of 82,679,832 people shows a substantial negative correlation between the proportion of Alsatians and percentage of population currently divorced or separated in the United States with a correlation coefficient (R) of -0.534 and weighted average of 11.9%, a difference of 11.7%.
Divorced or Separated Correlation Summary
| Measurement | Immigrants from Iran | Alsatian |
| Minimum | 1.6% | 1.8% |
| Maximum | 21.9% | 25.3% |
| Range | 20.3% | 23.5% |
| Mean | 9.5% | 11.4% |
| Median | 10.1% | 12.1% |
| Interquartile 25% (IQ1) | 8.6% | 10.4% |
| Interquartile 75% (IQ3) | 11.1% | 12.8% |
| Interquartile Range (IQR) | 2.5% | 2.4% |
| Standard Deviation (Sample) | 3.1% | 5.0% |
| Standard Deviation (Population) | 3.1% | 4.9% |
Similar Demographics by Divorced or Separated
Demographics Similar to Immigrants from Iran by Divorced or Separated
In terms of divorced or separated, the demographic groups most similar to Immigrants from Iran are Asian (10.6%, a difference of 0.0%), Immigrants from Israel (10.6%, a difference of 0.090%), Immigrants from Korea (10.6%, a difference of 0.19%), Immigrants from Armenia (10.6%, a difference of 0.63%), and Assyrian/Chaldean/Syriac (10.6%, a difference of 0.70%).
| Demographics | Rating | Rank | Divorced or Separated |
| Immigrants | South Central Asia | 100.0 /100 | #11 | Exceptional 10.4% |
| Okinawans | 100.0 /100 | #12 | Exceptional 10.5% |
| Cypriots | 100.0 /100 | #13 | Exceptional 10.5% |
| Assyrians/Chaldeans/Syriacs | 100.0 /100 | #14 | Exceptional 10.6% |
| Immigrants | Armenia | 100.0 /100 | #15 | Exceptional 10.6% |
| Immigrants | Korea | 100.0 /100 | #16 | Exceptional 10.6% |
| Immigrants | Israel | 100.0 /100 | #17 | Exceptional 10.6% |
| Immigrants | Iran | 100.0 /100 | #18 | Exceptional 10.6% |
| Asians | 100.0 /100 | #19 | Exceptional 10.6% |
| Burmese | 100.0 /100 | #20 | Exceptional 10.7% |
| Immigrants | Asia | 100.0 /100 | #21 | Exceptional 10.7% |
| Vietnamese | 100.0 /100 | #22 | Exceptional 10.8% |
| Immigrants | Pakistan | 100.0 /100 | #23 | Exceptional 10.8% |
| Immigrants | Sri Lanka | 100.0 /100 | #24 | Exceptional 10.8% |
| Iranians | 100.0 /100 | #25 | Exceptional 10.8% |
Demographics Similar to Alsatians by Divorced or Separated
In terms of divorced or separated, the demographic groups most similar to Alsatians are Immigrants from Netherlands (11.9%, a difference of 0.0%), Australian (11.9%, a difference of 0.020%), Lebanese (11.9%, a difference of 0.040%), Danish (11.9%, a difference of 0.060%), and Carpatho Rusyn (11.9%, a difference of 0.060%).
| Demographics | Rating | Rank | Divorced or Separated |
| Immigrants | Austria | 88.2 /100 | #130 | Excellent 11.8% |
| Immigrants | Cambodia | 88.2 /100 | #131 | Excellent 11.8% |
| Immigrants | Afghanistan | 87.9 /100 | #132 | Excellent 11.8% |
| New Zealanders | 87.5 /100 | #133 | Excellent 11.9% |
| Argentineans | 85.1 /100 | #134 | Excellent 11.9% |
| Danes | 84.8 /100 | #135 | Excellent 11.9% |
| Carpatho Rusyns | 84.8 /100 | #136 | Excellent 11.9% |
| Alsatians | 84.0 /100 | #137 | Excellent 11.9% |
| Immigrants | Netherlands | 83.9 /100 | #138 | Excellent 11.9% |
| Australians | 83.6 /100 | #139 | Excellent 11.9% |
| Lebanese | 83.4 /100 | #140 | Excellent 11.9% |
| Immigrants | Morocco | 82.9 /100 | #141 | Excellent 11.9% |
| Immigrants | Zimbabwe | 81.5 /100 | #142 | Excellent 11.9% |
| Pakistanis | 81.3 /100 | #143 | Excellent 11.9% |
| Peruvians | 80.9 /100 | #144 | Excellent 11.9% |