Sudanese vs Crow Currently Married
COMPARE
Sudanese
Crow
Currently Married
Currently Married Comparison
Sudanese
Crow
43.7%
CURRENTLY MARRIED
0.1/ 100
METRIC RATING
264th/ 347
METRIC RANK
40.4%
CURRENTLY MARRIED
0.0/ 100
METRIC RATING
329th/ 347
METRIC RANK
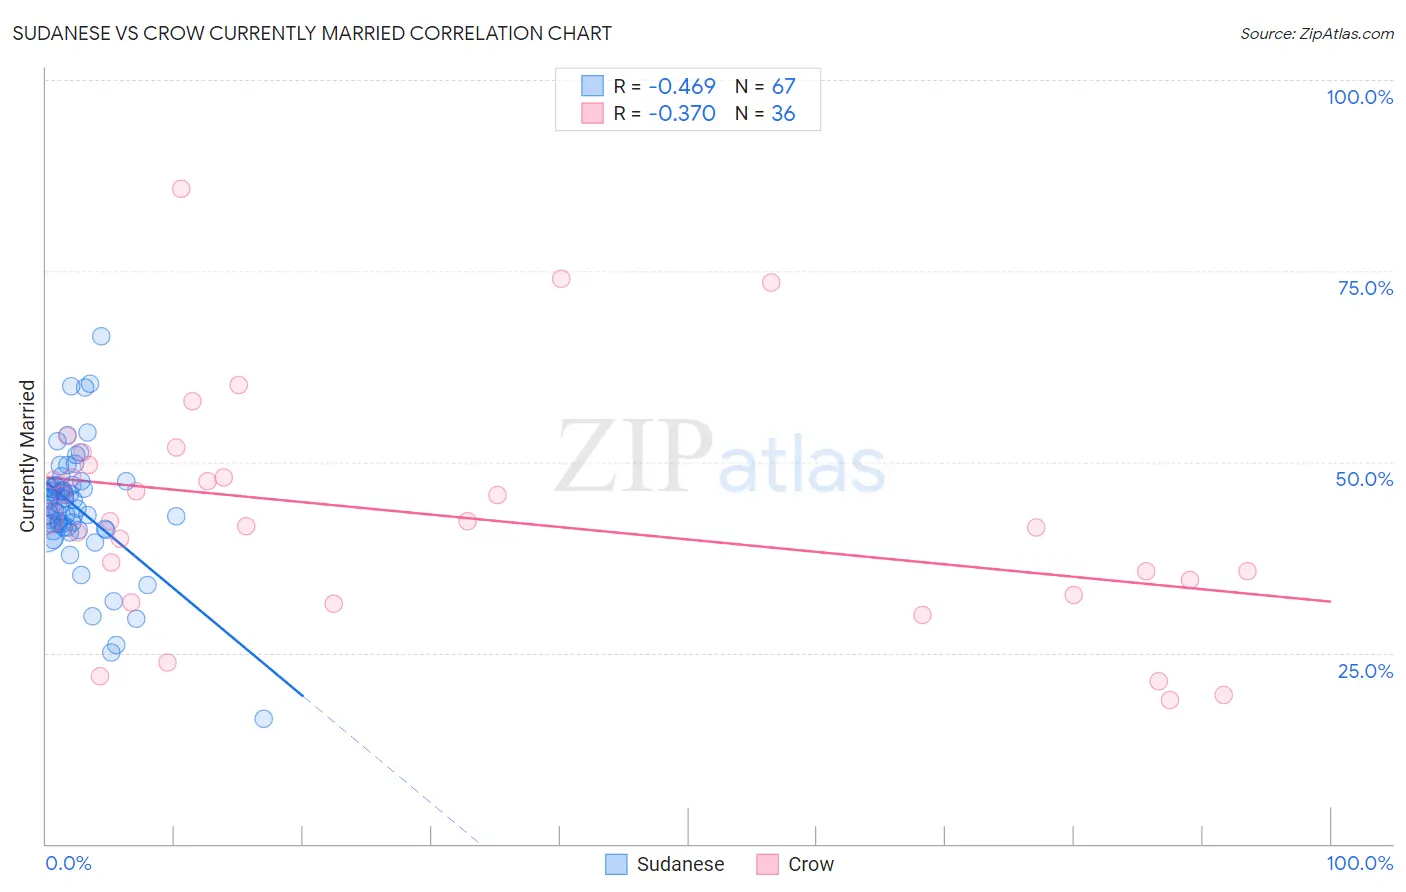
Sudanese vs Crow Currently Married Correlation Chart
The statistical analysis conducted on geographies consisting of 110,133,540 people shows a moderate negative correlation between the proportion of Sudanese and percentage of population currently married in the United States with a correlation coefficient (R) of -0.469 and weighted average of 43.7%. Similarly, the statistical analysis conducted on geographies consisting of 59,208,662 people shows a mild negative correlation between the proportion of Crow and percentage of population currently married in the United States with a correlation coefficient (R) of -0.370 and weighted average of 40.4%, a difference of 8.1%.
Currently Married Correlation Summary
| Measurement | Sudanese | Crow |
| Minimum | 16.3% | 18.8% |
| Maximum | 66.4% | 85.8% |
| Range | 50.1% | 67.0% |
| Mean | 43.9% | 43.0% |
| Median | 44.3% | 42.2% |
| Interquartile 25% (IQ1) | 41.3% | 33.5% |
| Interquartile 75% (IQ3) | 46.9% | 48.8% |
| Interquartile Range (IQR) | 5.6% | 15.3% |
| Standard Deviation (Sample) | 8.0% | 15.0% |
| Standard Deviation (Population) | 7.9% | 14.8% |
Similar Demographics by Currently Married
Demographics Similar to Sudanese by Currently Married
In terms of currently married, the demographic groups most similar to Sudanese are Immigrants from Cuba (43.7%, a difference of 0.010%), Bangladeshi (43.7%, a difference of 0.050%), Immigrants from Bangladesh (43.6%, a difference of 0.080%), Ecuadorian (43.6%, a difference of 0.15%), and Immigrants from Eritrea (43.6%, a difference of 0.18%).
| Demographics | Rating | Rank | Currently Married |
| Immigrants | Africa | 0.2 /100 | #257 | Tragic 43.9% |
| Ute | 0.2 /100 | #258 | Tragic 43.9% |
| Immigrants | Sierra Leone | 0.1 /100 | #259 | Tragic 43.8% |
| Immigrants | Latin America | 0.1 /100 | #260 | Tragic 43.8% |
| Immigrants | Nicaragua | 0.1 /100 | #261 | Tragic 43.7% |
| Bangladeshis | 0.1 /100 | #262 | Tragic 43.7% |
| Immigrants | Cuba | 0.1 /100 | #263 | Tragic 43.7% |
| Sudanese | 0.1 /100 | #264 | Tragic 43.7% |
| Immigrants | Bangladesh | 0.1 /100 | #265 | Tragic 43.6% |
| Ecuadorians | 0.1 /100 | #266 | Tragic 43.6% |
| Immigrants | Eritrea | 0.1 /100 | #267 | Tragic 43.6% |
| Spanish American Indians | 0.1 /100 | #268 | Tragic 43.6% |
| Immigrants | Sudan | 0.1 /100 | #269 | Tragic 43.5% |
| Salvadorans | 0.1 /100 | #270 | Tragic 43.5% |
| Bermudans | 0.1 /100 | #271 | Tragic 43.5% |
Demographics Similar to Crow by Currently Married
In terms of currently married, the demographic groups most similar to Crow are Immigrants from Dominica (40.3%, a difference of 0.090%), Immigrants from Barbados (40.3%, a difference of 0.10%), Arapaho (40.5%, a difference of 0.43%), Senegalese (40.6%, a difference of 0.47%), and Barbadian (40.6%, a difference of 0.65%).
| Demographics | Rating | Rank | Currently Married |
| Immigrants | Haiti | 0.0 /100 | #322 | Tragic 41.0% |
| Immigrants | West Indies | 0.0 /100 | #323 | Tragic 40.7% |
| Immigrants | Senegal | 0.0 /100 | #324 | Tragic 40.7% |
| U.S. Virgin Islanders | 0.0 /100 | #325 | Tragic 40.7% |
| Barbadians | 0.0 /100 | #326 | Tragic 40.6% |
| Senegalese | 0.0 /100 | #327 | Tragic 40.6% |
| Arapaho | 0.0 /100 | #328 | Tragic 40.5% |
| Crow | 0.0 /100 | #329 | Tragic 40.4% |
| Immigrants | Dominica | 0.0 /100 | #330 | Tragic 40.3% |
| Immigrants | Barbados | 0.0 /100 | #331 | Tragic 40.3% |
| Immigrants | St. Vincent and the Grenadines | 0.0 /100 | #332 | Tragic 40.1% |
| Yup'ik | 0.0 /100 | #333 | Tragic 39.9% |
| Puerto Ricans | 0.0 /100 | #334 | Tragic 39.9% |
| Lumbee | 0.0 /100 | #335 | Tragic 39.8% |
| British West Indians | 0.0 /100 | #336 | Tragic 39.8% |