Sudanese vs Finnish Births to Unmarried Women
COMPARE
Sudanese
Finnish
Births to Unmarried Women
Births to Unmarried Women Comparison
Sudanese
Finns
32.4%
BIRTHS TO UNMARRIED WOMEN
27.3/ 100
METRIC RATING
194th/ 347
METRIC RANK
31.7%
BIRTHS TO UNMARRIED WOMEN
50.5/ 100
METRIC RATING
171st/ 347
METRIC RANK
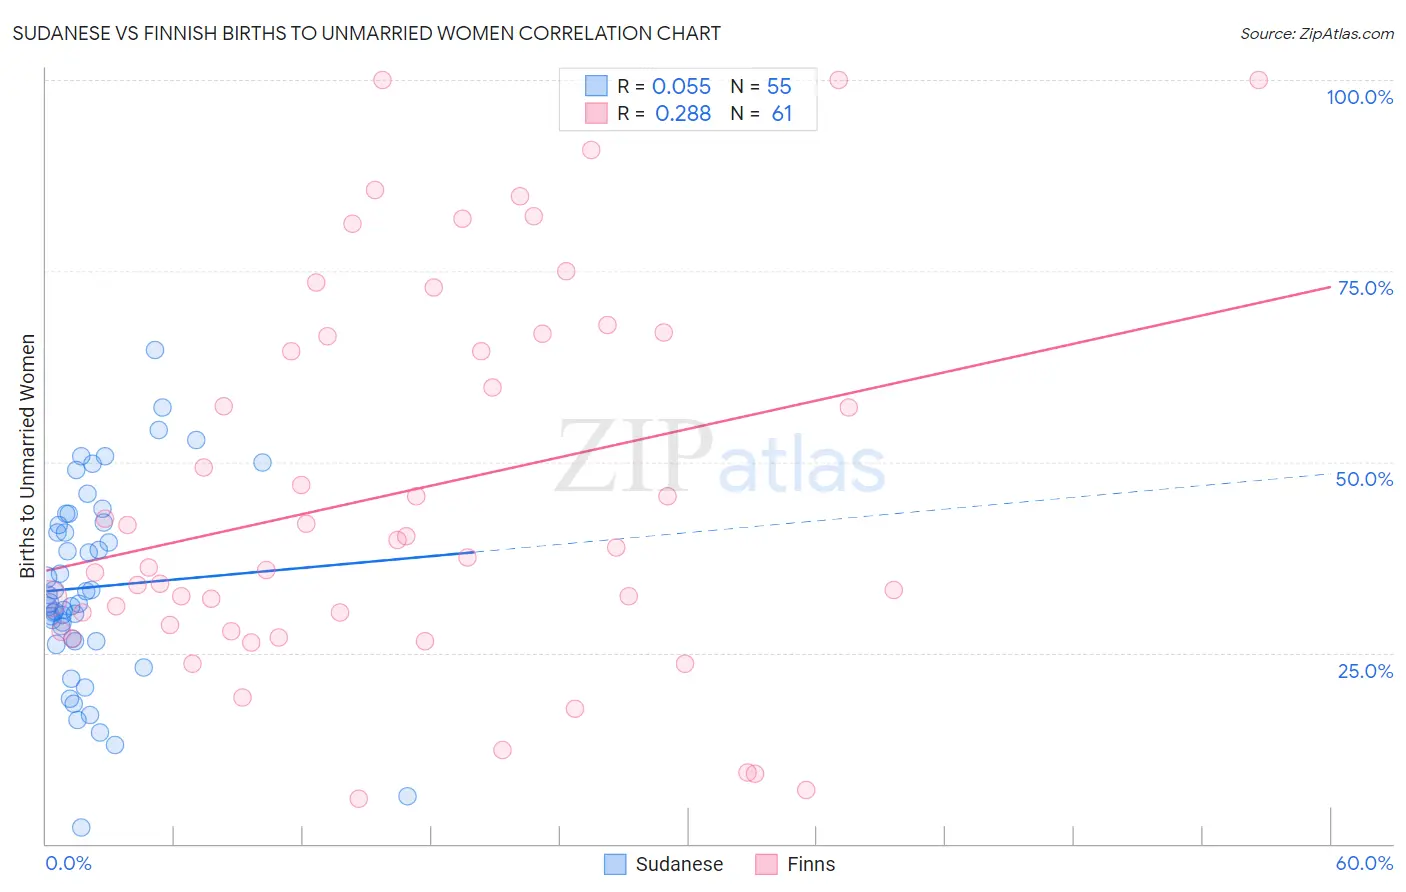
Sudanese vs Finnish Births to Unmarried Women Correlation Chart
The statistical analysis conducted on geographies consisting of 107,881,308 people shows a slight positive correlation between the proportion of Sudanese and percentage of births to unmarried women in the United States with a correlation coefficient (R) of 0.055 and weighted average of 32.4%. Similarly, the statistical analysis conducted on geographies consisting of 371,602,091 people shows a weak positive correlation between the proportion of Finns and percentage of births to unmarried women in the United States with a correlation coefficient (R) of 0.288 and weighted average of 31.7%, a difference of 2.4%.
Births to Unmarried Women Correlation Summary
| Measurement | Sudanese | Finnish |
| Minimum | 2.2% | 5.8% |
| Maximum | 64.6% | 100.0% |
| Range | 62.4% | 94.2% |
| Mean | 33.6% | 46.2% |
| Median | 31.5% | 38.9% |
| Interquartile 25% (IQ1) | 26.5% | 28.2% |
| Interquartile 75% (IQ3) | 42.0% | 66.5% |
| Interquartile Range (IQR) | 15.5% | 38.3% |
| Standard Deviation (Sample) | 12.8% | 24.9% |
| Standard Deviation (Population) | 12.6% | 24.7% |
Similar Demographics by Births to Unmarried Women
Demographics Similar to Sudanese by Births to Unmarried Women
In terms of births to unmarried women, the demographic groups most similar to Sudanese are Fijian (32.3%, a difference of 0.42%), Colombian (32.2%, a difference of 0.51%), Irish (32.2%, a difference of 0.57%), Tlingit-Haida (32.2%, a difference of 0.59%), and Samoan (32.6%, a difference of 0.67%).
| Demographics | Rating | Rank | Births to Unmarried Women |
| Czechoslovakians | 38.0 /100 | #187 | Fair 32.0% |
| Osage | 37.1 /100 | #188 | Fair 32.1% |
| Immigrants | Kenya | 36.9 /100 | #189 | Fair 32.1% |
| Tlingit-Haida | 32.6 /100 | #190 | Fair 32.2% |
| Irish | 32.4 /100 | #191 | Fair 32.2% |
| Colombians | 31.9 /100 | #192 | Fair 32.2% |
| Fijians | 31.1 /100 | #193 | Fair 32.3% |
| Sudanese | 27.3 /100 | #194 | Fair 32.4% |
| Samoans | 21.9 /100 | #195 | Fair 32.6% |
| Immigrants | Colombia | 21.7 /100 | #196 | Fair 32.6% |
| Immigrants | Immigrants | 20.6 /100 | #197 | Fair 32.7% |
| Costa Ricans | 20.3 /100 | #198 | Fair 32.7% |
| Immigrants | Thailand | 18.9 /100 | #199 | Poor 32.8% |
| Immigrants | Germany | 18.8 /100 | #200 | Poor 32.8% |
| Immigrants | Burma/Myanmar | 16.7 /100 | #201 | Poor 32.9% |
Demographics Similar to Finns by Births to Unmarried Women
In terms of births to unmarried women, the demographic groups most similar to Finns are Immigrants from Eritrea (31.7%, a difference of 0.010%), Immigrants from Yemen (31.7%, a difference of 0.030%), Venezuelan (31.7%, a difference of 0.050%), Guamanian/Chamorro (31.6%, a difference of 0.080%), and Immigrants from Venezuela (31.7%, a difference of 0.12%).
| Demographics | Rating | Rank | Births to Unmarried Women |
| Hungarians | 64.1 /100 | #164 | Good 31.2% |
| Immigrants | Somalia | 58.1 /100 | #165 | Average 31.4% |
| Peruvians | 55.5 /100 | #166 | Average 31.5% |
| Dutch | 55.3 /100 | #167 | Average 31.5% |
| Belgians | 52.4 /100 | #168 | Average 31.6% |
| Slavs | 52.0 /100 | #169 | Average 31.6% |
| Guamanians/Chamorros | 51.3 /100 | #170 | Average 31.6% |
| Finns | 50.5 /100 | #171 | Average 31.7% |
| Immigrants | Eritrea | 50.4 /100 | #172 | Average 31.7% |
| Immigrants | Yemen | 50.2 /100 | #173 | Average 31.7% |
| Venezuelans | 50.0 /100 | #174 | Average 31.7% |
| Immigrants | Venezuela | 49.2 /100 | #175 | Average 31.7% |
| Scottish | 48.1 /100 | #176 | Average 31.7% |
| South American Indians | 47.7 /100 | #177 | Average 31.7% |
| English | 47.4 /100 | #178 | Average 31.7% |