Immigrants from Norway vs Finnish Births to Unmarried Women
COMPARE
Immigrants from Norway
Finnish
Births to Unmarried Women
Births to Unmarried Women Comparison
Immigrants from Norway
Finns
29.9%
BIRTHS TO UNMARRIED WOMEN
91.0/ 100
METRIC RATING
118th/ 347
METRIC RANK
31.7%
BIRTHS TO UNMARRIED WOMEN
50.5/ 100
METRIC RATING
171st/ 347
METRIC RANK
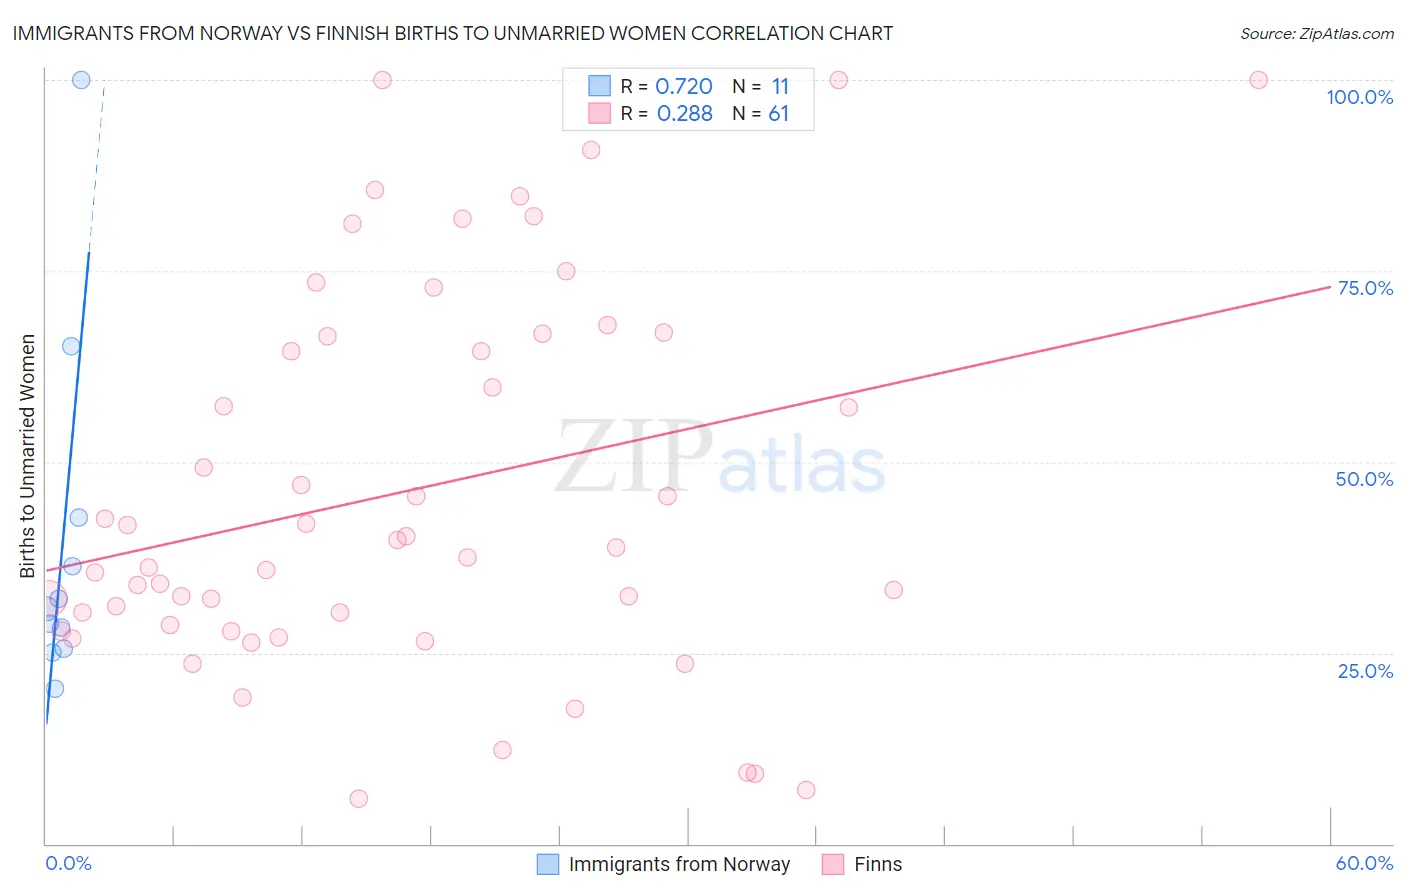
Immigrants from Norway vs Finnish Births to Unmarried Women Correlation Chart
The statistical analysis conducted on geographies consisting of 112,150,385 people shows a strong positive correlation between the proportion of Immigrants from Norway and percentage of births to unmarried women in the United States with a correlation coefficient (R) of 0.720 and weighted average of 29.9%. Similarly, the statistical analysis conducted on geographies consisting of 371,602,091 people shows a weak positive correlation between the proportion of Finns and percentage of births to unmarried women in the United States with a correlation coefficient (R) of 0.288 and weighted average of 31.7%, a difference of 5.7%.
Births to Unmarried Women Correlation Summary
| Measurement | Immigrants from Norway | Finnish |
| Minimum | 20.3% | 5.8% |
| Maximum | 100.0% | 100.0% |
| Range | 79.7% | 94.2% |
| Mean | 39.6% | 46.2% |
| Median | 30.7% | 38.9% |
| Interquartile 25% (IQ1) | 25.5% | 28.2% |
| Interquartile 75% (IQ3) | 42.7% | 66.5% |
| Interquartile Range (IQR) | 17.2% | 38.3% |
| Standard Deviation (Sample) | 23.4% | 24.9% |
| Standard Deviation (Population) | 22.3% | 24.7% |
Similar Demographics by Births to Unmarried Women
Demographics Similar to Immigrants from Norway by Births to Unmarried Women
In terms of births to unmarried women, the demographic groups most similar to Immigrants from Norway are Immigrants from Netherlands (29.9%, a difference of 0.020%), Argentinean (30.0%, a difference of 0.14%), Immigrants from Italy (29.9%, a difference of 0.23%), Ethiopian (29.8%, a difference of 0.31%), and Ugandan (30.1%, a difference of 0.50%).
| Demographics | Rating | Rank | Births to Unmarried Women |
| Immigrants | Hungary | 93.0 /100 | #111 | Exceptional 29.7% |
| Basques | 93.0 /100 | #112 | Exceptional 29.7% |
| Scandinavians | 92.7 /100 | #113 | Exceptional 29.8% |
| Immigrants | Croatia | 92.6 /100 | #114 | Exceptional 29.8% |
| Ethiopians | 91.9 /100 | #115 | Exceptional 29.8% |
| Immigrants | Italy | 91.7 /100 | #116 | Exceptional 29.9% |
| Immigrants | Netherlands | 91.1 /100 | #117 | Exceptional 29.9% |
| Immigrants | Norway | 91.0 /100 | #118 | Exceptional 29.9% |
| Argentineans | 90.5 /100 | #119 | Exceptional 30.0% |
| Ugandans | 89.2 /100 | #120 | Excellent 30.1% |
| Koreans | 88.9 /100 | #121 | Excellent 30.1% |
| Immigrants | Argentina | 88.7 /100 | #122 | Excellent 30.1% |
| Syrians | 88.2 /100 | #123 | Excellent 30.2% |
| Croatians | 88.0 /100 | #124 | Excellent 30.2% |
| Vietnamese | 87.7 /100 | #125 | Excellent 30.2% |
Demographics Similar to Finns by Births to Unmarried Women
In terms of births to unmarried women, the demographic groups most similar to Finns are Immigrants from Eritrea (31.7%, a difference of 0.010%), Immigrants from Yemen (31.7%, a difference of 0.030%), Venezuelan (31.7%, a difference of 0.050%), Guamanian/Chamorro (31.6%, a difference of 0.080%), and Immigrants from Venezuela (31.7%, a difference of 0.12%).
| Demographics | Rating | Rank | Births to Unmarried Women |
| Hungarians | 64.1 /100 | #164 | Good 31.2% |
| Immigrants | Somalia | 58.1 /100 | #165 | Average 31.4% |
| Peruvians | 55.5 /100 | #166 | Average 31.5% |
| Dutch | 55.3 /100 | #167 | Average 31.5% |
| Belgians | 52.4 /100 | #168 | Average 31.6% |
| Slavs | 52.0 /100 | #169 | Average 31.6% |
| Guamanians/Chamorros | 51.3 /100 | #170 | Average 31.6% |
| Finns | 50.5 /100 | #171 | Average 31.7% |
| Immigrants | Eritrea | 50.4 /100 | #172 | Average 31.7% |
| Immigrants | Yemen | 50.2 /100 | #173 | Average 31.7% |
| Venezuelans | 50.0 /100 | #174 | Average 31.7% |
| Immigrants | Venezuela | 49.2 /100 | #175 | Average 31.7% |
| Scottish | 48.1 /100 | #176 | Average 31.7% |
| South American Indians | 47.7 /100 | #177 | Average 31.7% |
| English | 47.4 /100 | #178 | Average 31.7% |