Immigrants from Sweden vs Finnish Births to Unmarried Women
COMPARE
Immigrants from Sweden
Finnish
Births to Unmarried Women
Births to Unmarried Women Comparison
Immigrants from Sweden
Finns
28.5%
BIRTHS TO UNMARRIED WOMEN
98.5/ 100
METRIC RATING
72nd/ 347
METRIC RANK
31.7%
BIRTHS TO UNMARRIED WOMEN
50.5/ 100
METRIC RATING
171st/ 347
METRIC RANK
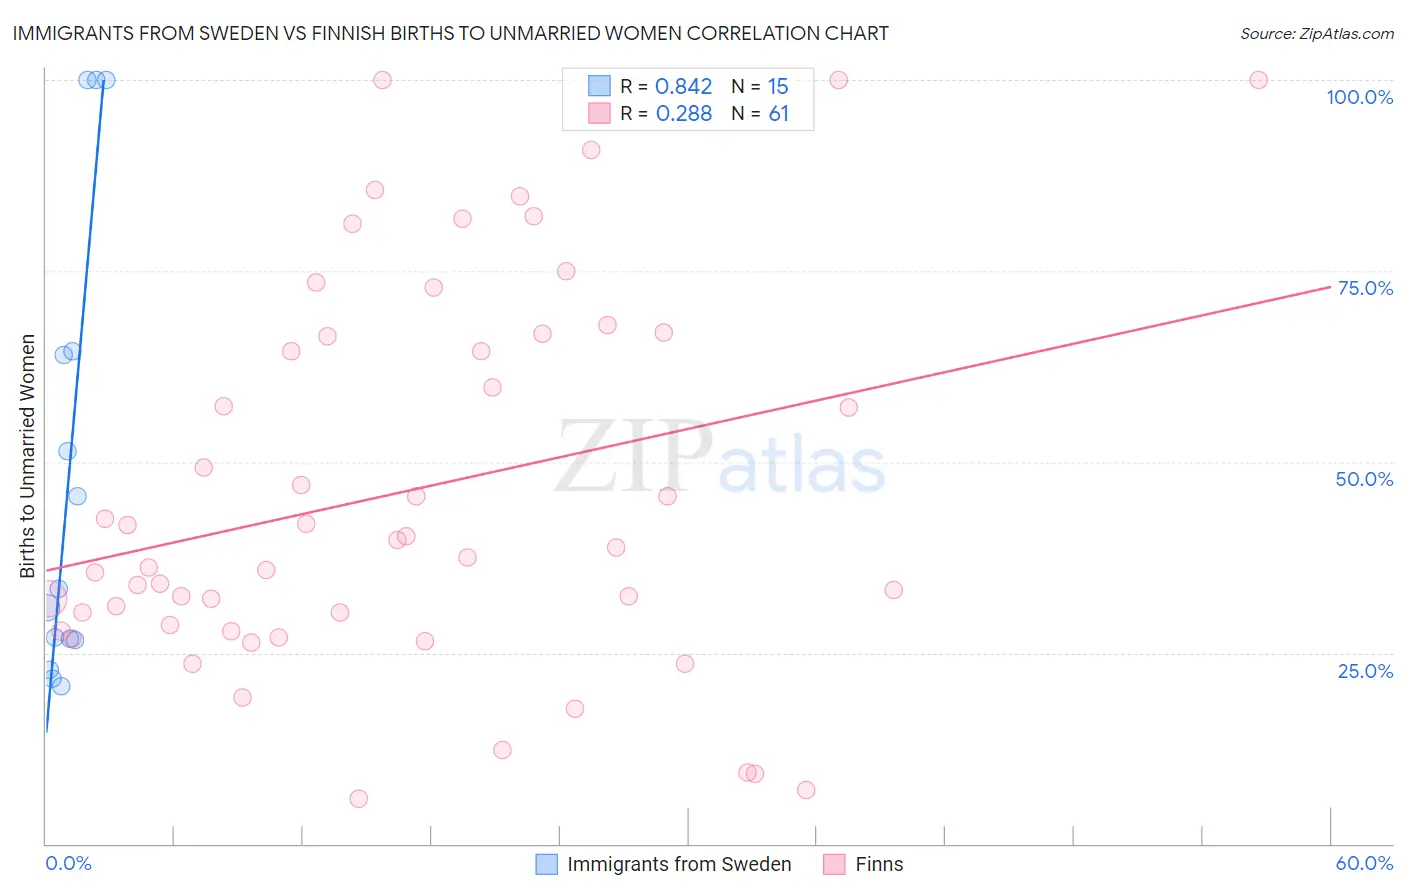
Immigrants from Sweden vs Finnish Births to Unmarried Women Correlation Chart
The statistical analysis conducted on geographies consisting of 155,904,998 people shows a very strong positive correlation between the proportion of Immigrants from Sweden and percentage of births to unmarried women in the United States with a correlation coefficient (R) of 0.842 and weighted average of 28.5%. Similarly, the statistical analysis conducted on geographies consisting of 371,602,091 people shows a weak positive correlation between the proportion of Finns and percentage of births to unmarried women in the United States with a correlation coefficient (R) of 0.288 and weighted average of 31.7%, a difference of 10.9%.
Births to Unmarried Women Correlation Summary
| Measurement | Immigrants from Sweden | Finnish |
| Minimum | 20.6% | 5.8% |
| Maximum | 100.0% | 100.0% |
| Range | 79.4% | 94.2% |
| Mean | 49.0% | 46.2% |
| Median | 33.4% | 38.9% |
| Interquartile 25% (IQ1) | 26.6% | 28.2% |
| Interquartile 75% (IQ3) | 64.5% | 66.5% |
| Interquartile Range (IQR) | 37.9% | 38.3% |
| Standard Deviation (Sample) | 30.0% | 24.9% |
| Standard Deviation (Population) | 29.0% | 24.7% |
Similar Demographics by Births to Unmarried Women
Demographics Similar to Immigrants from Sweden by Births to Unmarried Women
In terms of births to unmarried women, the demographic groups most similar to Immigrants from Sweden are Albanian (28.5%, a difference of 0.050%), Jordanian (28.5%, a difference of 0.060%), Immigrants from Bolivia (28.6%, a difference of 0.070%), Immigrants from Switzerland (28.6%, a difference of 0.16%), and Israeli (28.6%, a difference of 0.18%).
| Demographics | Rating | Rank | Births to Unmarried Women |
| Immigrants | Czechoslovakia | 98.8 /100 | #65 | Exceptional 28.4% |
| Immigrants | Egypt | 98.8 /100 | #66 | Exceptional 28.4% |
| Palestinians | 98.7 /100 | #67 | Exceptional 28.4% |
| Immigrants | Europe | 98.7 /100 | #68 | Exceptional 28.4% |
| Bolivians | 98.7 /100 | #69 | Exceptional 28.5% |
| Laotians | 98.6 /100 | #70 | Exceptional 28.5% |
| Jordanians | 98.5 /100 | #71 | Exceptional 28.5% |
| Immigrants | Sweden | 98.5 /100 | #72 | Exceptional 28.5% |
| Albanians | 98.5 /100 | #73 | Exceptional 28.5% |
| Immigrants | Bolivia | 98.5 /100 | #74 | Exceptional 28.6% |
| Immigrants | Switzerland | 98.4 /100 | #75 | Exceptional 28.6% |
| Israelis | 98.4 /100 | #76 | Exceptional 28.6% |
| Immigrants | Northern Europe | 98.3 /100 | #77 | Exceptional 28.6% |
| Zimbabweans | 98.2 /100 | #78 | Exceptional 28.7% |
| Danes | 98.2 /100 | #79 | Exceptional 28.7% |
Demographics Similar to Finns by Births to Unmarried Women
In terms of births to unmarried women, the demographic groups most similar to Finns are Immigrants from Eritrea (31.7%, a difference of 0.010%), Immigrants from Yemen (31.7%, a difference of 0.030%), Venezuelan (31.7%, a difference of 0.050%), Guamanian/Chamorro (31.6%, a difference of 0.080%), and Immigrants from Venezuela (31.7%, a difference of 0.12%).
| Demographics | Rating | Rank | Births to Unmarried Women |
| Hungarians | 64.1 /100 | #164 | Good 31.2% |
| Immigrants | Somalia | 58.1 /100 | #165 | Average 31.4% |
| Peruvians | 55.5 /100 | #166 | Average 31.5% |
| Dutch | 55.3 /100 | #167 | Average 31.5% |
| Belgians | 52.4 /100 | #168 | Average 31.6% |
| Slavs | 52.0 /100 | #169 | Average 31.6% |
| Guamanians/Chamorros | 51.3 /100 | #170 | Average 31.6% |
| Finns | 50.5 /100 | #171 | Average 31.7% |
| Immigrants | Eritrea | 50.4 /100 | #172 | Average 31.7% |
| Immigrants | Yemen | 50.2 /100 | #173 | Average 31.7% |
| Venezuelans | 50.0 /100 | #174 | Average 31.7% |
| Immigrants | Venezuela | 49.2 /100 | #175 | Average 31.7% |
| Scottish | 48.1 /100 | #176 | Average 31.7% |
| South American Indians | 47.7 /100 | #177 | Average 31.7% |
| English | 47.4 /100 | #178 | Average 31.7% |