English vs Finnish Births to Unmarried Women
COMPARE
English
Finnish
Births to Unmarried Women
Births to Unmarried Women Comparison
English
Finns
31.7%
BIRTHS TO UNMARRIED WOMEN
47.4/ 100
METRIC RATING
178th/ 347
METRIC RANK
31.7%
BIRTHS TO UNMARRIED WOMEN
50.5/ 100
METRIC RATING
171st/ 347
METRIC RANK
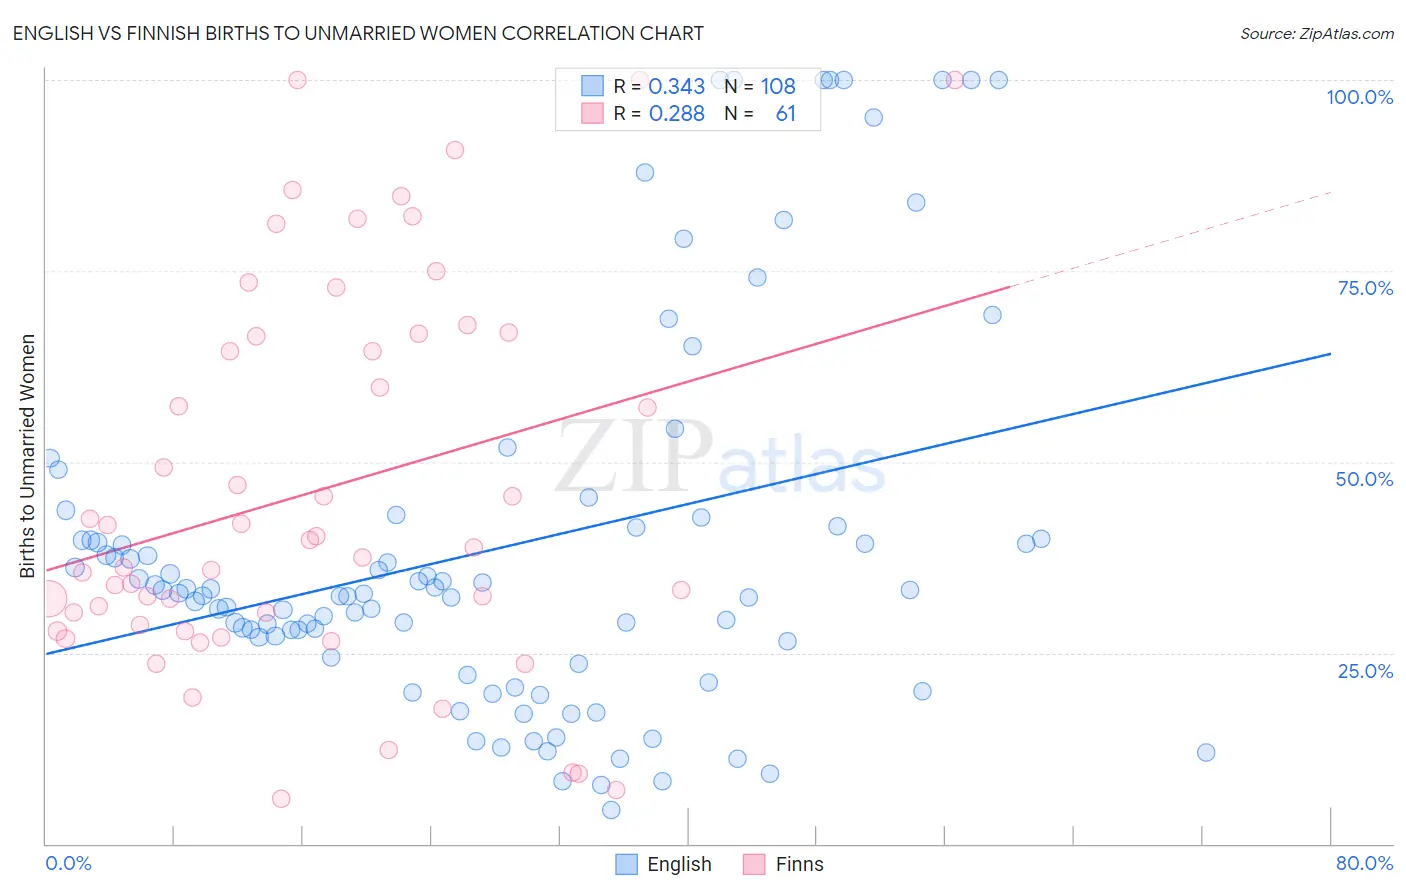
English vs Finnish Births to Unmarried Women Correlation Chart
The statistical analysis conducted on geographies consisting of 509,798,956 people shows a mild positive correlation between the proportion of English and percentage of births to unmarried women in the United States with a correlation coefficient (R) of 0.343 and weighted average of 31.7%. Similarly, the statistical analysis conducted on geographies consisting of 371,602,091 people shows a weak positive correlation between the proportion of Finns and percentage of births to unmarried women in the United States with a correlation coefficient (R) of 0.288 and weighted average of 31.7%, a difference of 0.30%.
Births to Unmarried Women Correlation Summary
| Measurement | English | Finnish |
| Minimum | 4.5% | 5.8% |
| Maximum | 100.0% | 100.0% |
| Range | 95.5% | 94.2% |
| Mean | 38.5% | 46.2% |
| Median | 32.8% | 38.9% |
| Interquartile 25% (IQ1) | 25.5% | 28.2% |
| Interquartile 75% (IQ3) | 40.7% | 66.5% |
| Interquartile Range (IQR) | 15.2% | 38.3% |
| Standard Deviation (Sample) | 24.5% | 24.9% |
| Standard Deviation (Population) | 24.3% | 24.7% |
Demographics Similar to English and Finns by Births to Unmarried Women
In terms of births to unmarried women, the demographic groups most similar to English are South American Indian (31.7%, a difference of 0.030%), South American (31.8%, a difference of 0.040%), Scottish (31.7%, a difference of 0.070%), Moroccan (31.8%, a difference of 0.15%), and Immigrants from Venezuela (31.7%, a difference of 0.17%). Similarly, the demographic groups most similar to Finns are Immigrants from Eritrea (31.7%, a difference of 0.010%), Immigrants from Yemen (31.7%, a difference of 0.030%), Venezuelan (31.7%, a difference of 0.050%), Guamanian/Chamorro (31.6%, a difference of 0.080%), and Immigrants from Venezuela (31.7%, a difference of 0.12%).
| Demographics | Rating | Rank | Births to Unmarried Women |
| Hungarians | 64.1 /100 | #164 | Good 31.2% |
| Immigrants | Somalia | 58.1 /100 | #165 | Average 31.4% |
| Peruvians | 55.5 /100 | #166 | Average 31.5% |
| Dutch | 55.3 /100 | #167 | Average 31.5% |
| Belgians | 52.4 /100 | #168 | Average 31.6% |
| Slavs | 52.0 /100 | #169 | Average 31.6% |
| Guamanians/Chamorros | 51.3 /100 | #170 | Average 31.6% |
| Finns | 50.5 /100 | #171 | Average 31.7% |
| Immigrants | Eritrea | 50.4 /100 | #172 | Average 31.7% |
| Immigrants | Yemen | 50.2 /100 | #173 | Average 31.7% |
| Venezuelans | 50.0 /100 | #174 | Average 31.7% |
| Immigrants | Venezuela | 49.2 /100 | #175 | Average 31.7% |
| Scottish | 48.1 /100 | #176 | Average 31.7% |
| South American Indians | 47.7 /100 | #177 | Average 31.7% |
| English | 47.4 /100 | #178 | Average 31.7% |
| South Americans | 46.9 /100 | #179 | Average 31.8% |
| Moroccans | 45.7 /100 | #180 | Average 31.8% |
| Immigrants | Peru | 45.1 /100 | #181 | Average 31.8% |
| Kenyans | 43.0 /100 | #182 | Average 31.9% |
| Canadians | 41.4 /100 | #183 | Average 31.9% |
| Immigrants | South America | 40.7 /100 | #184 | Average 32.0% |