Sudanese vs Finnish Unemployment Among Ages 16 to 19 years
COMPARE
Sudanese
Finnish
Unemployment Among Ages 16 to 19 years
Unemployment Among Ages 16 to 19 years Comparison
Sudanese
Finns
15.8%
UNEMPLOYMENT AMONG AGES 16 TO 19 YEARS
100.0/ 100
METRIC RATING
20th/ 347
METRIC RANK
15.9%
UNEMPLOYMENT AMONG AGES 16 TO 19 YEARS
100.0/ 100
METRIC RATING
22nd/ 347
METRIC RANK
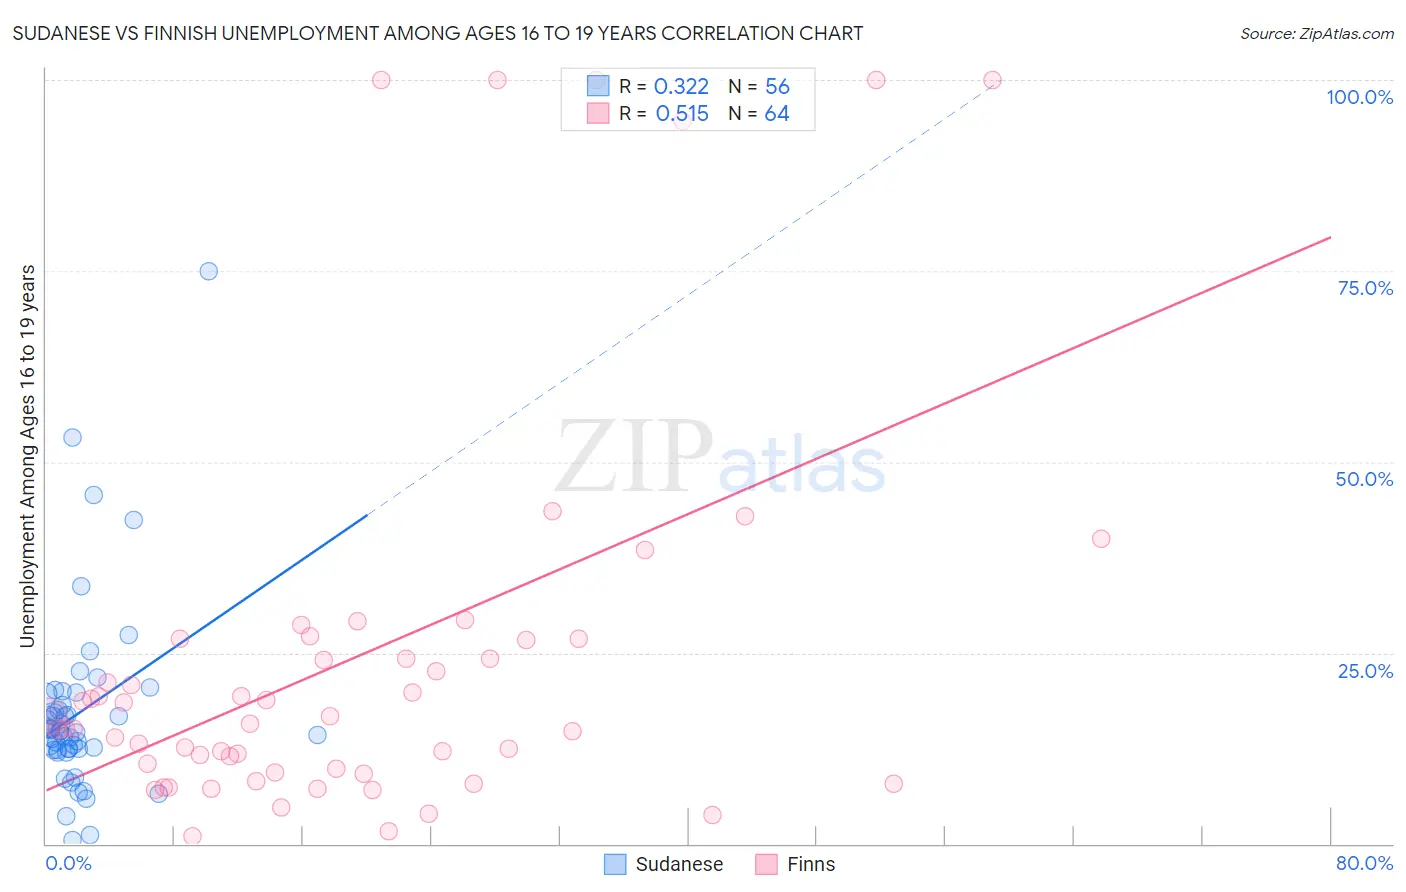
Sudanese vs Finnish Unemployment Among Ages 16 to 19 years Correlation Chart
The statistical analysis conducted on geographies consisting of 108,384,842 people shows a mild positive correlation between the proportion of Sudanese and unemployment rate among population between the ages 16 and 19 in the United States with a correlation coefficient (R) of 0.322 and weighted average of 15.8%. Similarly, the statistical analysis conducted on geographies consisting of 379,037,944 people shows a substantial positive correlation between the proportion of Finns and unemployment rate among population between the ages 16 and 19 in the United States with a correlation coefficient (R) of 0.515 and weighted average of 15.9%, a difference of 0.69%.
Unemployment Among Ages 16 to 19 years Correlation Summary
| Measurement | Sudanese | Finnish |
| Minimum | 0.50% | 1.0% |
| Maximum | 75.0% | 100.0% |
| Range | 74.5% | 99.0% |
| Mean | 17.3% | 24.5% |
| Median | 14.8% | 16.2% |
| Interquartile 25% (IQ1) | 12.4% | 9.6% |
| Interquartile 75% (IQ3) | 18.9% | 26.7% |
| Interquartile Range (IQR) | 6.5% | 17.1% |
| Standard Deviation (Sample) | 12.3% | 26.0% |
| Standard Deviation (Population) | 12.2% | 25.8% |
Demographics Similar to Sudanese and Finns by Unemployment Among Ages 16 to 19 years
In terms of unemployment among ages 16 to 19 years, the demographic groups most similar to Sudanese are Swiss (15.8%, a difference of 0.10%), Thai (15.7%, a difference of 0.21%), Immigrants from Taiwan (15.8%, a difference of 0.33%), Somali (15.7%, a difference of 0.44%), and German (15.7%, a difference of 0.66%). Similarly, the demographic groups most similar to Finns are Belgian (15.9%, a difference of 0.040%), Tongan (15.9%, a difference of 0.19%), Filipino (15.9%, a difference of 0.29%), Immigrants from Taiwan (15.8%, a difference of 0.36%), and Dutch (15.9%, a difference of 0.36%).
| Demographics | Rating | Rank | Unemployment Among Ages 16 to 19 years |
| Indonesians | 100.0 /100 | #11 | Exceptional 15.5% |
| Taiwanese | 100.0 /100 | #12 | Exceptional 15.5% |
| Immigrants | Burma/Myanmar | 100.0 /100 | #13 | Exceptional 15.6% |
| Immigrants | Zaire | 100.0 /100 | #14 | Exceptional 15.6% |
| Yugoslavians | 100.0 /100 | #15 | Exceptional 15.6% |
| Germans | 100.0 /100 | #16 | Exceptional 15.7% |
| Somalis | 100.0 /100 | #17 | Exceptional 15.7% |
| Thais | 100.0 /100 | #18 | Exceptional 15.7% |
| Swiss | 100.0 /100 | #19 | Exceptional 15.8% |
| Sudanese | 100.0 /100 | #20 | Exceptional 15.8% |
| Immigrants | Taiwan | 100.0 /100 | #21 | Exceptional 15.8% |
| Finns | 100.0 /100 | #22 | Exceptional 15.9% |
| Belgians | 100.0 /100 | #23 | Exceptional 15.9% |
| Tongans | 100.0 /100 | #24 | Exceptional 15.9% |
| Filipinos | 100.0 /100 | #25 | Exceptional 15.9% |
| Dutch | 100.0 /100 | #26 | Exceptional 15.9% |
| Immigrants | Sudan | 99.9 /100 | #27 | Exceptional 16.0% |
| Jordanians | 99.9 /100 | #28 | Exceptional 16.0% |
| Chinese | 99.9 /100 | #29 | Exceptional 16.0% |
| Kenyans | 99.9 /100 | #30 | Exceptional 16.1% |
| English | 99.9 /100 | #31 | Exceptional 16.1% |