Subsaharan African vs Immigrants from Grenada 1st Grade
COMPARE
Subsaharan African
Immigrants from Grenada
1st Grade
1st Grade Comparison
Sub-Saharan Africans
Immigrants from Grenada
97.7%
1ST GRADE
3.6/ 100
METRIC RATING
228th/ 347
METRIC RANK
97.2%
1ST GRADE
0.0/ 100
METRIC RATING
294th/ 347
METRIC RANK
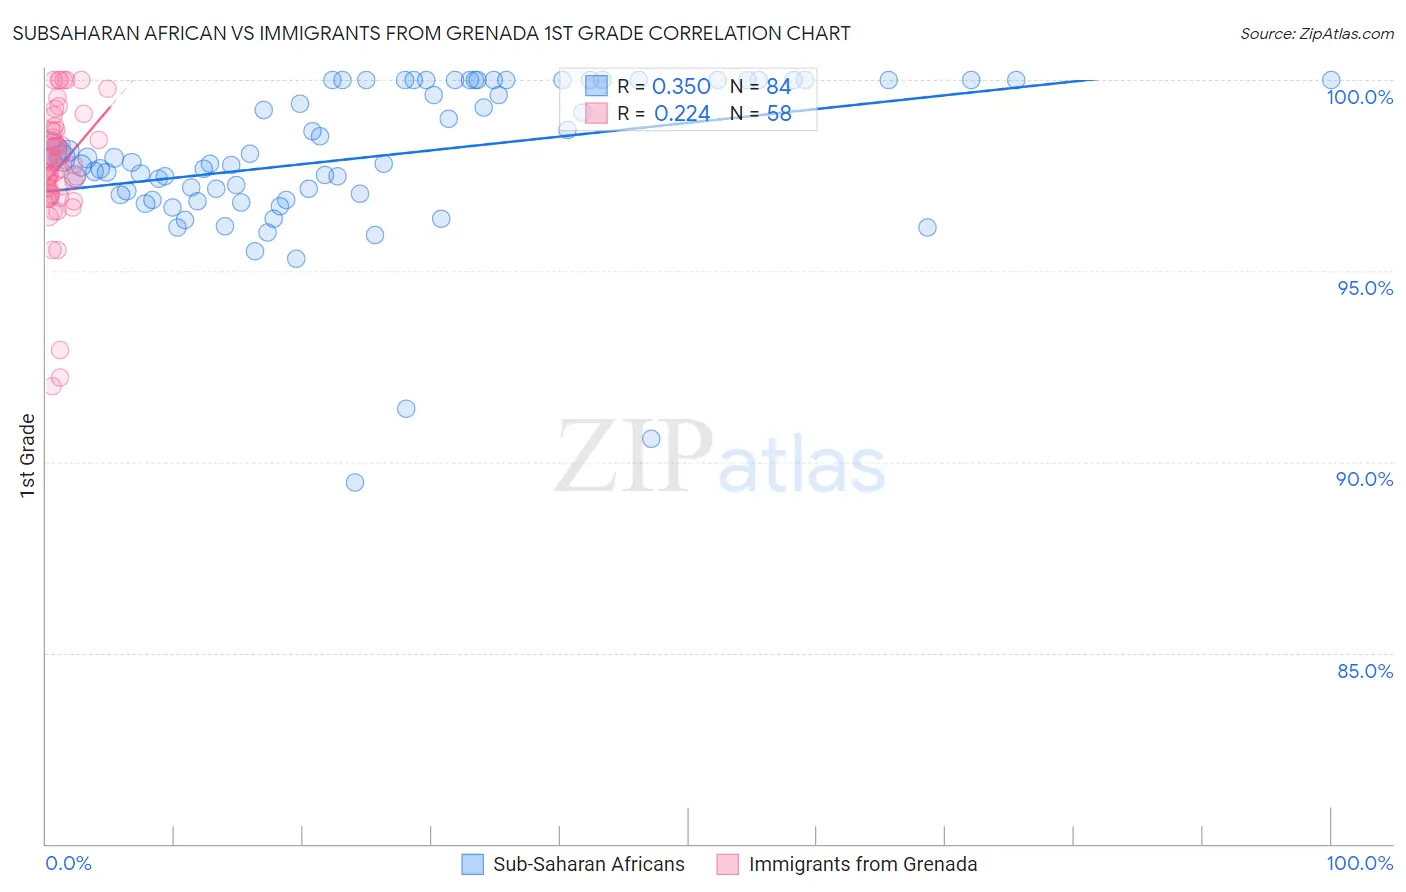
Subsaharan African vs Immigrants from Grenada 1st Grade Correlation Chart
The statistical analysis conducted on geographies consisting of 508,209,936 people shows a mild positive correlation between the proportion of Sub-Saharan Africans and percentage of population with at least 1st grade education in the United States with a correlation coefficient (R) of 0.350 and weighted average of 97.7%. Similarly, the statistical analysis conducted on geographies consisting of 67,200,336 people shows a weak positive correlation between the proportion of Immigrants from Grenada and percentage of population with at least 1st grade education in the United States with a correlation coefficient (R) of 0.224 and weighted average of 97.2%, a difference of 0.51%.
1st Grade Correlation Summary
| Measurement | Subsaharan African | Immigrants from Grenada |
| Minimum | 89.5% | 92.0% |
| Maximum | 100.0% | 100.0% |
| Range | 10.5% | 8.0% |
| Mean | 98.0% | 97.7% |
| Median | 97.9% | 97.8% |
| Interquartile 25% (IQ1) | 97.0% | 97.0% |
| Interquartile 75% (IQ3) | 100.0% | 98.7% |
| Interquartile Range (IQR) | 3.0% | 1.7% |
| Standard Deviation (Sample) | 2.0% | 1.7% |
| Standard Deviation (Population) | 2.0% | 1.7% |
Similar Demographics by 1st Grade
Demographics Similar to Sub-Saharan Africans by 1st Grade
In terms of 1st grade, the demographic groups most similar to Sub-Saharan Africans are Sudanese (97.7%, a difference of 0.0%), Sierra Leonean (97.7%, a difference of 0.0%), Immigrants from Costa Rica (97.7%, a difference of 0.0%), Senegalese (97.7%, a difference of 0.0%), and Immigrants from Sudan (97.7%, a difference of 0.010%).
| Demographics | Rating | Rank | 1st Grade |
| Immigrants | Sudan | 4.3 /100 | #221 | Tragic 97.7% |
| Immigrants | Syria | 4.2 /100 | #222 | Tragic 97.7% |
| Immigrants | Zaire | 4.1 /100 | #223 | Tragic 97.7% |
| Iraqis | 4.0 /100 | #224 | Tragic 97.7% |
| Immigrants | Nepal | 4.0 /100 | #225 | Tragic 97.7% |
| Sudanese | 3.7 /100 | #226 | Tragic 97.7% |
| Sierra Leoneans | 3.6 /100 | #227 | Tragic 97.7% |
| Sub-Saharan Africans | 3.6 /100 | #228 | Tragic 97.7% |
| Immigrants | Costa Rica | 3.5 /100 | #229 | Tragic 97.7% |
| Senegalese | 3.5 /100 | #230 | Tragic 97.7% |
| Puerto Ricans | 3.0 /100 | #231 | Tragic 97.7% |
| Immigrants | Uruguay | 2.5 /100 | #232 | Tragic 97.6% |
| Immigrants | Pakistan | 2.2 /100 | #233 | Tragic 97.6% |
| Colombians | 2.2 /100 | #234 | Tragic 97.6% |
| Immigrants | Malaysia | 2.1 /100 | #235 | Tragic 97.6% |
Demographics Similar to Immigrants from Grenada by 1st Grade
In terms of 1st grade, the demographic groups most similar to Immigrants from Grenada are Immigrants (97.2%, a difference of 0.010%), Immigrants from Eritrea (97.2%, a difference of 0.010%), Malaysian (97.2%, a difference of 0.020%), British West Indian (97.2%, a difference of 0.040%), and Houma (97.2%, a difference of 0.060%).
| Demographics | Rating | Rank | 1st Grade |
| Immigrants | Hong Kong | 0.0 /100 | #287 | Tragic 97.3% |
| Immigrants | Thailand | 0.0 /100 | #288 | Tragic 97.3% |
| Immigrants | Afghanistan | 0.0 /100 | #289 | Tragic 97.3% |
| Immigrants | St. Vincent and the Grenadines | 0.0 /100 | #290 | Tragic 97.3% |
| Houma | 0.0 /100 | #291 | Tragic 97.2% |
| British West Indians | 0.0 /100 | #292 | Tragic 97.2% |
| Malaysians | 0.0 /100 | #293 | Tragic 97.2% |
| Immigrants | Grenada | 0.0 /100 | #294 | Tragic 97.2% |
| Immigrants | Immigrants | 0.0 /100 | #295 | Tragic 97.2% |
| Immigrants | Eritrea | 0.0 /100 | #296 | Tragic 97.2% |
| Central American Indians | 0.0 /100 | #297 | Tragic 97.1% |
| Immigrants | Dominica | 0.0 /100 | #298 | Tragic 97.1% |
| Immigrants | Cuba | 0.0 /100 | #299 | Tragic 97.1% |
| Haitians | 0.0 /100 | #300 | Tragic 97.1% |
| Immigrants | South Eastern Asia | 0.0 /100 | #301 | Tragic 97.1% |