Immigrants from North America vs Immigrants from Colombia Single Mother Households
COMPARE
Immigrants from North America
Immigrants from Colombia
Single Mother Households
Single Mother Households Comparison
Immigrants from North America
Immigrants from Colombia
5.6%
SINGLE MOTHER HOUSEHOLDS
98.3/ 100
METRIC RATING
74th/ 347
METRIC RANK
6.7%
SINGLE MOTHER HOUSEHOLDS
10.5/ 100
METRIC RATING
209th/ 347
METRIC RANK
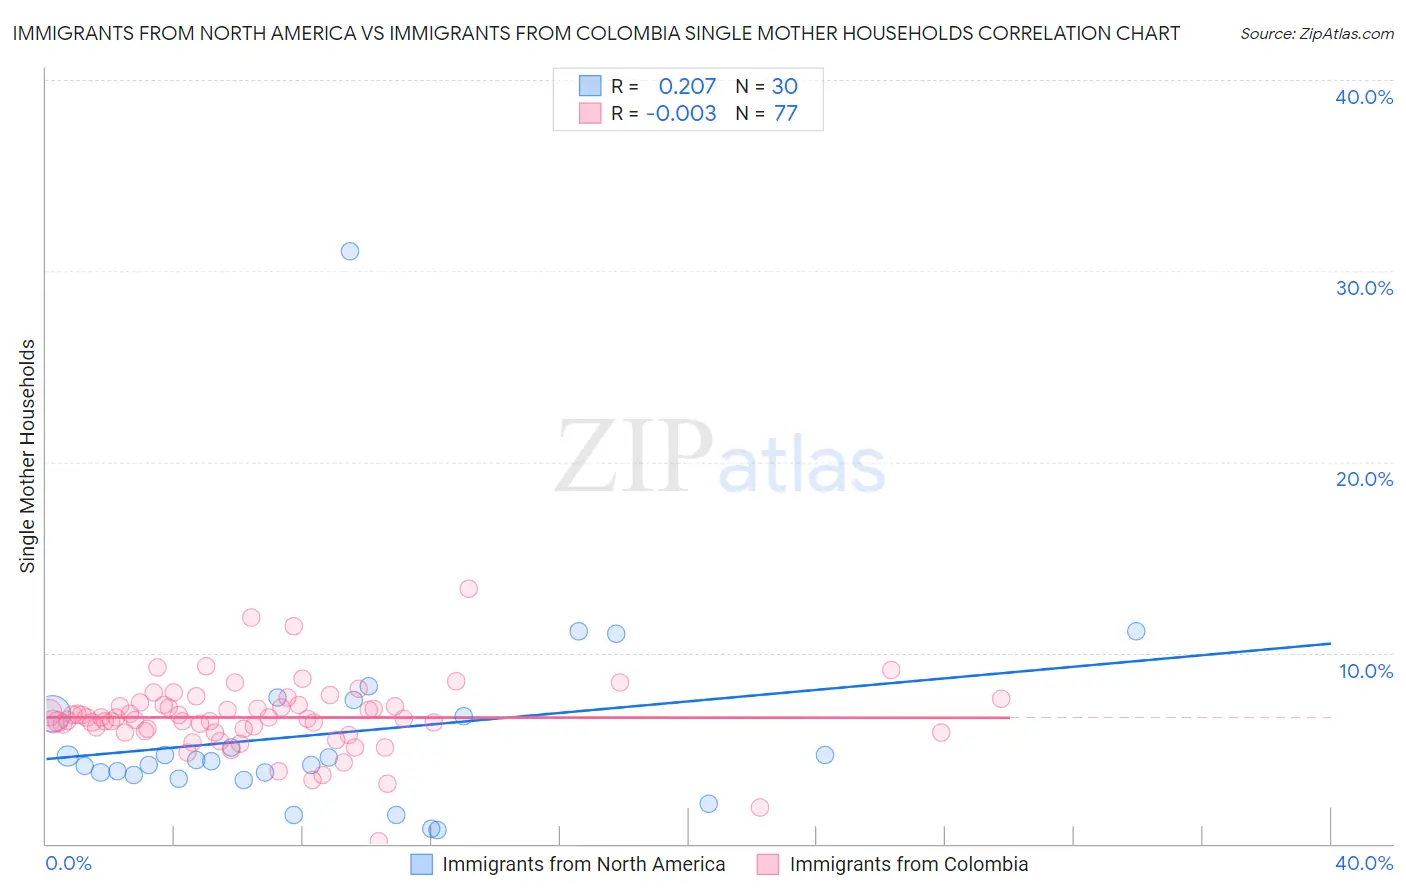
Immigrants from North America vs Immigrants from Colombia Single Mother Households Correlation Chart
The statistical analysis conducted on geographies consisting of 460,394,376 people shows a weak positive correlation between the proportion of Immigrants from North America and percentage of single mother households in the United States with a correlation coefficient (R) of 0.207 and weighted average of 5.6%. Similarly, the statistical analysis conducted on geographies consisting of 377,860,755 people shows no correlation between the proportion of Immigrants from Colombia and percentage of single mother households in the United States with a correlation coefficient (R) of -0.003 and weighted average of 6.7%, a difference of 19.2%.
Single Mother Households Correlation Summary
| Measurement | Immigrants from North America | Immigrants from Colombia |
| Minimum | 0.70% | 0.15% |
| Maximum | 31.0% | 13.3% |
| Range | 30.3% | 13.2% |
| Mean | 5.8% | 6.6% |
| Median | 4.4% | 6.6% |
| Interquartile 25% (IQ1) | 3.6% | 5.9% |
| Interquartile 75% (IQ3) | 6.8% | 7.3% |
| Interquartile Range (IQR) | 3.2% | 1.4% |
| Standard Deviation (Sample) | 5.5% | 1.9% |
| Standard Deviation (Population) | 5.4% | 1.9% |
Similar Demographics by Single Mother Households
Demographics Similar to Immigrants from North America by Single Mother Households
In terms of single mother households, the demographic groups most similar to Immigrants from North America are Immigrants from Asia (5.6%, a difference of 0.030%), Immigrants from Netherlands (5.6%, a difference of 0.090%), Slovene (5.6%, a difference of 0.14%), Immigrants from Kazakhstan (5.6%, a difference of 0.18%), and Immigrants from Eastern Europe (5.6%, a difference of 0.19%).
| Demographics | Rating | Rank | Single Mother Households |
| Italians | 98.5 /100 | #67 | Exceptional 5.6% |
| Immigrants | Bulgaria | 98.5 /100 | #68 | Exceptional 5.6% |
| Asians | 98.5 /100 | #69 | Exceptional 5.6% |
| Immigrants | Eastern Europe | 98.4 /100 | #70 | Exceptional 5.6% |
| Immigrants | Kazakhstan | 98.4 /100 | #71 | Exceptional 5.6% |
| Immigrants | Netherlands | 98.4 /100 | #72 | Exceptional 5.6% |
| Immigrants | Asia | 98.4 /100 | #73 | Exceptional 5.6% |
| Immigrants | North America | 98.3 /100 | #74 | Exceptional 5.6% |
| Slovenes | 98.3 /100 | #75 | Exceptional 5.6% |
| New Zealanders | 98.2 /100 | #76 | Exceptional 5.6% |
| Romanians | 98.1 /100 | #77 | Exceptional 5.6% |
| Swiss | 98.1 /100 | #78 | Exceptional 5.6% |
| Immigrants | Sri Lanka | 98.0 /100 | #79 | Exceptional 5.6% |
| Czechs | 97.9 /100 | #80 | Exceptional 5.6% |
| Immigrants | Moldova | 97.9 /100 | #81 | Exceptional 5.6% |
Demographics Similar to Immigrants from Colombia by Single Mother Households
In terms of single mother households, the demographic groups most similar to Immigrants from Colombia are Nonimmigrants (6.7%, a difference of 0.020%), Vietnamese (6.7%, a difference of 0.21%), German Russian (6.7%, a difference of 0.27%), Immigrants from South America (6.7%, a difference of 0.27%), and Cree (6.7%, a difference of 0.35%).
| Demographics | Rating | Rank | Single Mother Households |
| Guamanians/Chamorros | 12.4 /100 | #202 | Poor 6.6% |
| Immigrants | Peru | 12.0 /100 | #203 | Poor 6.7% |
| Immigrants | Fiji | 11.9 /100 | #204 | Poor 6.7% |
| Cree | 11.9 /100 | #205 | Poor 6.7% |
| German Russians | 11.5 /100 | #206 | Poor 6.7% |
| Immigrants | South America | 11.5 /100 | #207 | Poor 6.7% |
| Vietnamese | 11.3 /100 | #208 | Poor 6.7% |
| Immigrants | Colombia | 10.5 /100 | #209 | Poor 6.7% |
| Immigrants | Nonimmigrants | 10.4 /100 | #210 | Poor 6.7% |
| Immigrants | Venezuela | 8.5 /100 | #211 | Tragic 6.7% |
| Immigrants | Eritrea | 8.4 /100 | #212 | Tragic 6.7% |
| Immigrants | Costa Rica | 8.2 /100 | #213 | Tragic 6.7% |
| Immigrants | Uruguay | 7.9 /100 | #214 | Tragic 6.7% |
| Shoshone | 5.7 /100 | #215 | Tragic 6.8% |
| Cherokee | 5.1 /100 | #216 | Tragic 6.8% |