Immigrants from Eastern Africa vs Immigrants from Colombia Single Mother Households
COMPARE
Immigrants from Eastern Africa
Immigrants from Colombia
Single Mother Households
Single Mother Households Comparison
Immigrants from Eastern Africa
Immigrants from Colombia
6.8%
SINGLE MOTHER HOUSEHOLDS
4.4/ 100
METRIC RATING
218th/ 347
METRIC RANK
6.7%
SINGLE MOTHER HOUSEHOLDS
10.5/ 100
METRIC RATING
209th/ 347
METRIC RANK
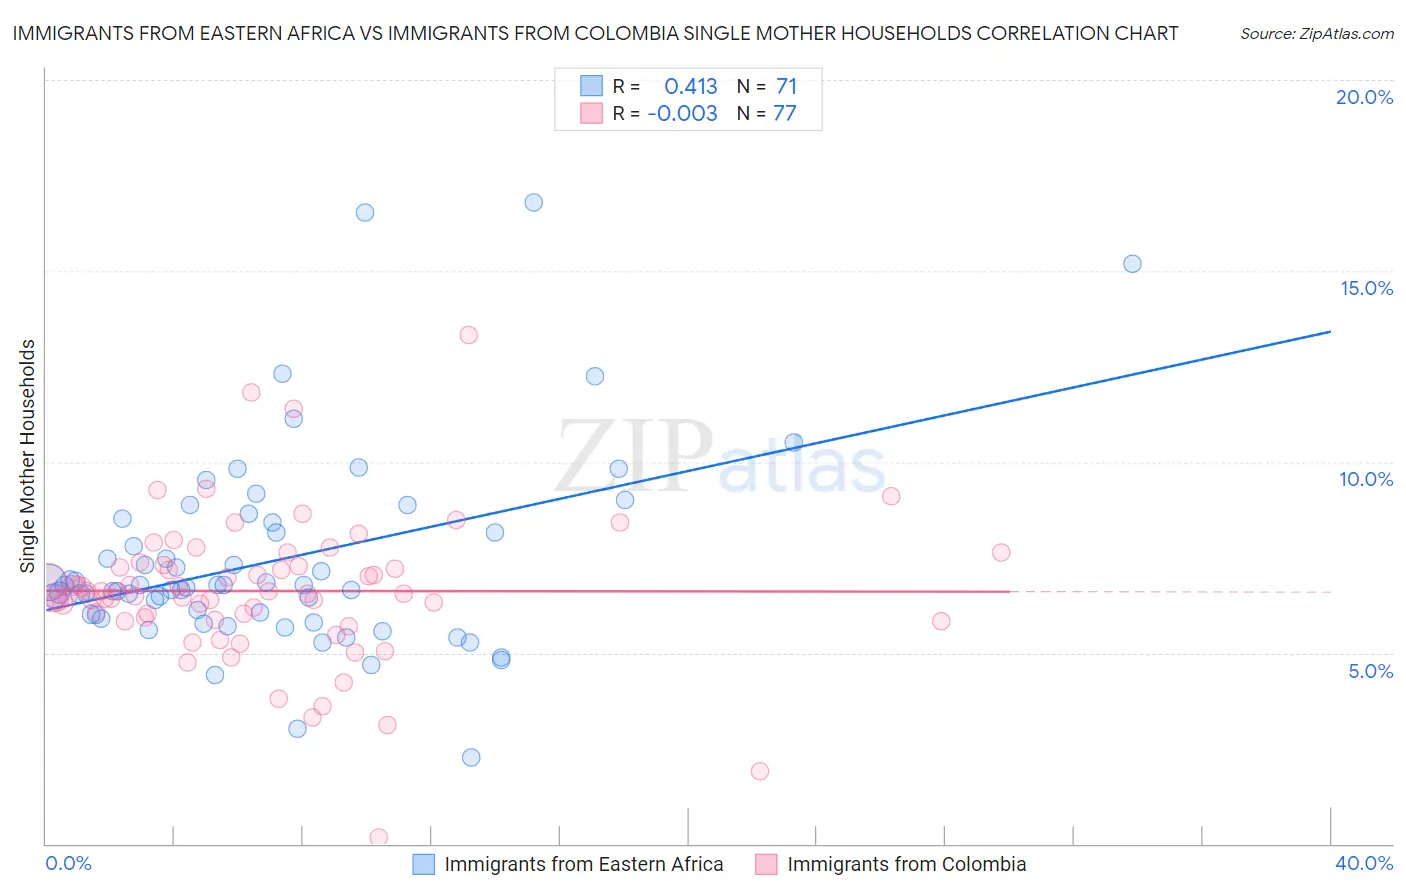
Immigrants from Eastern Africa vs Immigrants from Colombia Single Mother Households Correlation Chart
The statistical analysis conducted on geographies consisting of 354,507,775 people shows a moderate positive correlation between the proportion of Immigrants from Eastern Africa and percentage of single mother households in the United States with a correlation coefficient (R) of 0.413 and weighted average of 6.8%. Similarly, the statistical analysis conducted on geographies consisting of 377,860,755 people shows no correlation between the proportion of Immigrants from Colombia and percentage of single mother households in the United States with a correlation coefficient (R) of -0.003 and weighted average of 6.7%, a difference of 2.4%.
Single Mother Households Correlation Summary
| Measurement | Immigrants from Eastern Africa | Immigrants from Colombia |
| Minimum | 2.3% | 0.15% |
| Maximum | 16.8% | 13.3% |
| Range | 14.5% | 13.2% |
| Mean | 7.4% | 6.6% |
| Median | 6.8% | 6.6% |
| Interquartile 25% (IQ1) | 6.0% | 5.9% |
| Interquartile 75% (IQ3) | 8.4% | 7.3% |
| Interquartile Range (IQR) | 2.4% | 1.4% |
| Standard Deviation (Sample) | 2.6% | 1.9% |
| Standard Deviation (Population) | 2.6% | 1.9% |
Demographics Similar to Immigrants from Eastern Africa and Immigrants from Colombia by Single Mother Households
In terms of single mother households, the demographic groups most similar to Immigrants from Eastern Africa are Immigrants (6.8%, a difference of 0.090%), Aleut (6.8%, a difference of 0.21%), Immigrants from Thailand (6.9%, a difference of 0.27%), Cherokee (6.8%, a difference of 0.36%), and French American Indian (6.9%, a difference of 0.47%). Similarly, the demographic groups most similar to Immigrants from Colombia are Nonimmigrants (6.7%, a difference of 0.020%), Vietnamese (6.7%, a difference of 0.21%), German Russian (6.7%, a difference of 0.27%), Immigrants from South America (6.7%, a difference of 0.27%), and Cree (6.7%, a difference of 0.35%).
| Demographics | Rating | Rank | Single Mother Households |
| Immigrants | Peru | 12.0 /100 | #203 | Poor 6.7% |
| Immigrants | Fiji | 11.9 /100 | #204 | Poor 6.7% |
| Cree | 11.9 /100 | #205 | Poor 6.7% |
| German Russians | 11.5 /100 | #206 | Poor 6.7% |
| Immigrants | South America | 11.5 /100 | #207 | Poor 6.7% |
| Vietnamese | 11.3 /100 | #208 | Poor 6.7% |
| Immigrants | Colombia | 10.5 /100 | #209 | Poor 6.7% |
| Immigrants | Nonimmigrants | 10.4 /100 | #210 | Poor 6.7% |
| Immigrants | Venezuela | 8.5 /100 | #211 | Tragic 6.7% |
| Immigrants | Eritrea | 8.4 /100 | #212 | Tragic 6.7% |
| Immigrants | Costa Rica | 8.2 /100 | #213 | Tragic 6.7% |
| Immigrants | Uruguay | 7.9 /100 | #214 | Tragic 6.7% |
| Shoshone | 5.7 /100 | #215 | Tragic 6.8% |
| Cherokee | 5.1 /100 | #216 | Tragic 6.8% |
| Aleuts | 4.8 /100 | #217 | Tragic 6.8% |
| Immigrants | Eastern Africa | 4.4 /100 | #218 | Tragic 6.8% |
| Immigrants | Immigrants | 4.3 /100 | #219 | Tragic 6.8% |
| Immigrants | Thailand | 4.0 /100 | #220 | Tragic 6.9% |
| French American Indians | 3.7 /100 | #221 | Tragic 6.9% |
| Immigrants | Bangladesh | 3.7 /100 | #222 | Tragic 6.9% |
| Immigrants | Micronesia | 3.6 /100 | #223 | Tragic 6.9% |