Spanish vs Eastern European Single Mother Households
COMPARE
Spanish
Eastern European
Single Mother Households
Single Mother Households Comparison
Spanish
Eastern Europeans
6.4%
SINGLE MOTHER HOUSEHOLDS
33.4/ 100
METRIC RATING
181st/ 347
METRIC RANK
5.2%
SINGLE MOTHER HOUSEHOLDS
99.8/ 100
METRIC RATING
21st/ 347
METRIC RANK
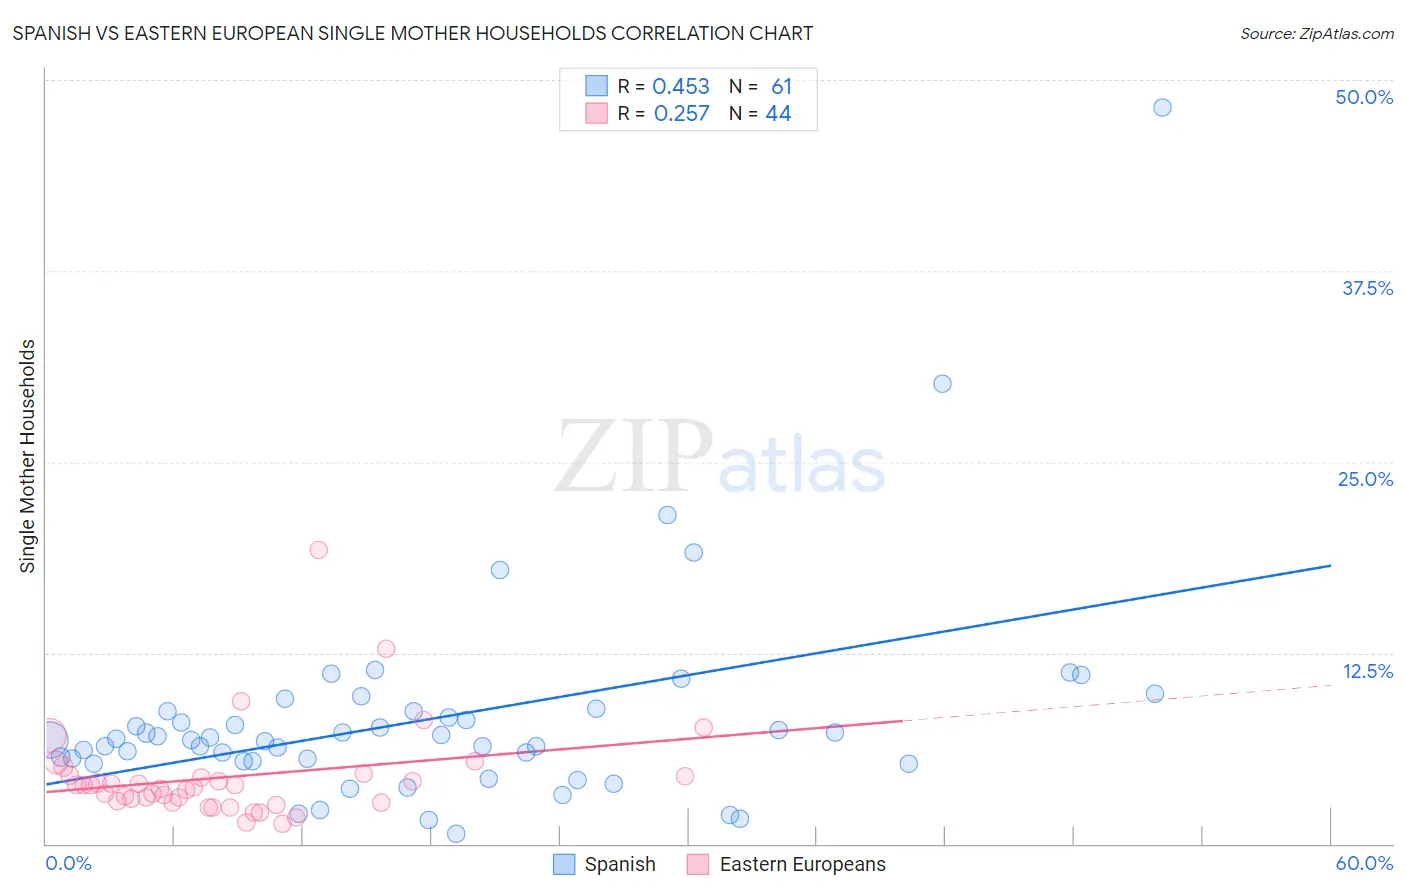
Spanish vs Eastern European Single Mother Households Correlation Chart
The statistical analysis conducted on geographies consisting of 420,668,605 people shows a moderate positive correlation between the proportion of Spanish and percentage of single mother households in the United States with a correlation coefficient (R) of 0.453 and weighted average of 6.4%. Similarly, the statistical analysis conducted on geographies consisting of 459,026,965 people shows a weak positive correlation between the proportion of Eastern Europeans and percentage of single mother households in the United States with a correlation coefficient (R) of 0.257 and weighted average of 5.2%, a difference of 23.9%.
Single Mother Households Correlation Summary
| Measurement | Spanish | Eastern European |
| Minimum | 0.65% | 1.3% |
| Maximum | 48.2% | 19.2% |
| Range | 47.5% | 18.0% |
| Mean | 8.2% | 4.4% |
| Median | 6.8% | 3.8% |
| Interquartile 25% (IQ1) | 5.4% | 2.7% |
| Interquartile 75% (IQ3) | 8.7% | 4.5% |
| Interquartile Range (IQR) | 3.3% | 1.7% |
| Standard Deviation (Sample) | 7.1% | 3.1% |
| Standard Deviation (Population) | 7.0% | 3.1% |
Similar Demographics by Single Mother Households
Demographics Similar to Spanish by Single Mother Households
In terms of single mother households, the demographic groups most similar to Spanish are South American Indian (6.4%, a difference of 0.0%), Immigrants from Nepal (6.4%, a difference of 0.32%), Spaniard (6.5%, a difference of 0.71%), Hmong (6.4%, a difference of 0.74%), and Portuguese (6.4%, a difference of 0.77%).
| Demographics | Rating | Rank | Single Mother Households |
| Immigrants | Morocco | 50.0 /100 | #174 | Average 6.3% |
| Marshallese | 45.8 /100 | #175 | Average 6.3% |
| Immigrants | Bosnia and Herzegovina | 44.3 /100 | #176 | Average 6.3% |
| Osage | 43.0 /100 | #177 | Average 6.4% |
| Portuguese | 40.0 /100 | #178 | Fair 6.4% |
| Hmong | 39.8 /100 | #179 | Fair 6.4% |
| Immigrants | Nepal | 36.1 /100 | #180 | Fair 6.4% |
| Spanish | 33.4 /100 | #181 | Fair 6.4% |
| South American Indians | 33.4 /100 | #182 | Fair 6.4% |
| Spaniards | 27.8 /100 | #183 | Fair 6.5% |
| Ethiopians | 26.0 /100 | #184 | Fair 6.5% |
| Ugandans | 25.6 /100 | #185 | Fair 6.5% |
| Costa Ricans | 24.8 /100 | #186 | Fair 6.5% |
| Immigrants | Afghanistan | 24.7 /100 | #187 | Fair 6.5% |
| Ottawa | 23.8 /100 | #188 | Fair 6.5% |
Demographics Similar to Eastern Europeans by Single Mother Households
In terms of single mother households, the demographic groups most similar to Eastern Europeans are Maltese (5.2%, a difference of 0.060%), Chinese (5.2%, a difference of 0.53%), Immigrants from Armenia (5.2%, a difference of 0.63%), Thai (5.2%, a difference of 0.72%), and Immigrants from Austria (5.2%, a difference of 0.77%).
| Demographics | Rating | Rank | Single Mother Households |
| Immigrants | Australia | 99.9 /100 | #14 | Exceptional 5.1% |
| Immigrants | Eastern Asia | 99.9 /100 | #15 | Exceptional 5.1% |
| Indians (Asian) | 99.9 /100 | #16 | Exceptional 5.1% |
| Soviet Union | 99.9 /100 | #17 | Exceptional 5.1% |
| Immigrants | Armenia | 99.9 /100 | #18 | Exceptional 5.2% |
| Chinese | 99.9 /100 | #19 | Exceptional 5.2% |
| Maltese | 99.9 /100 | #20 | Exceptional 5.2% |
| Eastern Europeans | 99.8 /100 | #21 | Exceptional 5.2% |
| Thais | 99.8 /100 | #22 | Exceptional 5.2% |
| Immigrants | Austria | 99.8 /100 | #23 | Exceptional 5.2% |
| Armenians | 99.8 /100 | #24 | Exceptional 5.2% |
| Immigrants | Japan | 99.8 /100 | #25 | Exceptional 5.2% |
| Immigrants | Lithuania | 99.8 /100 | #26 | Exceptional 5.3% |
| Bhutanese | 99.7 /100 | #27 | Exceptional 5.3% |
| Russians | 99.7 /100 | #28 | Exceptional 5.3% |