Afghan vs Eastern European Single Mother Households
COMPARE
Afghan
Eastern European
Single Mother Households
Single Mother Households Comparison
Afghans
Eastern Europeans
6.3%
SINGLE MOTHER HOUSEHOLDS
52.5/ 100
METRIC RATING
171st/ 347
METRIC RANK
5.2%
SINGLE MOTHER HOUSEHOLDS
99.8/ 100
METRIC RATING
21st/ 347
METRIC RANK
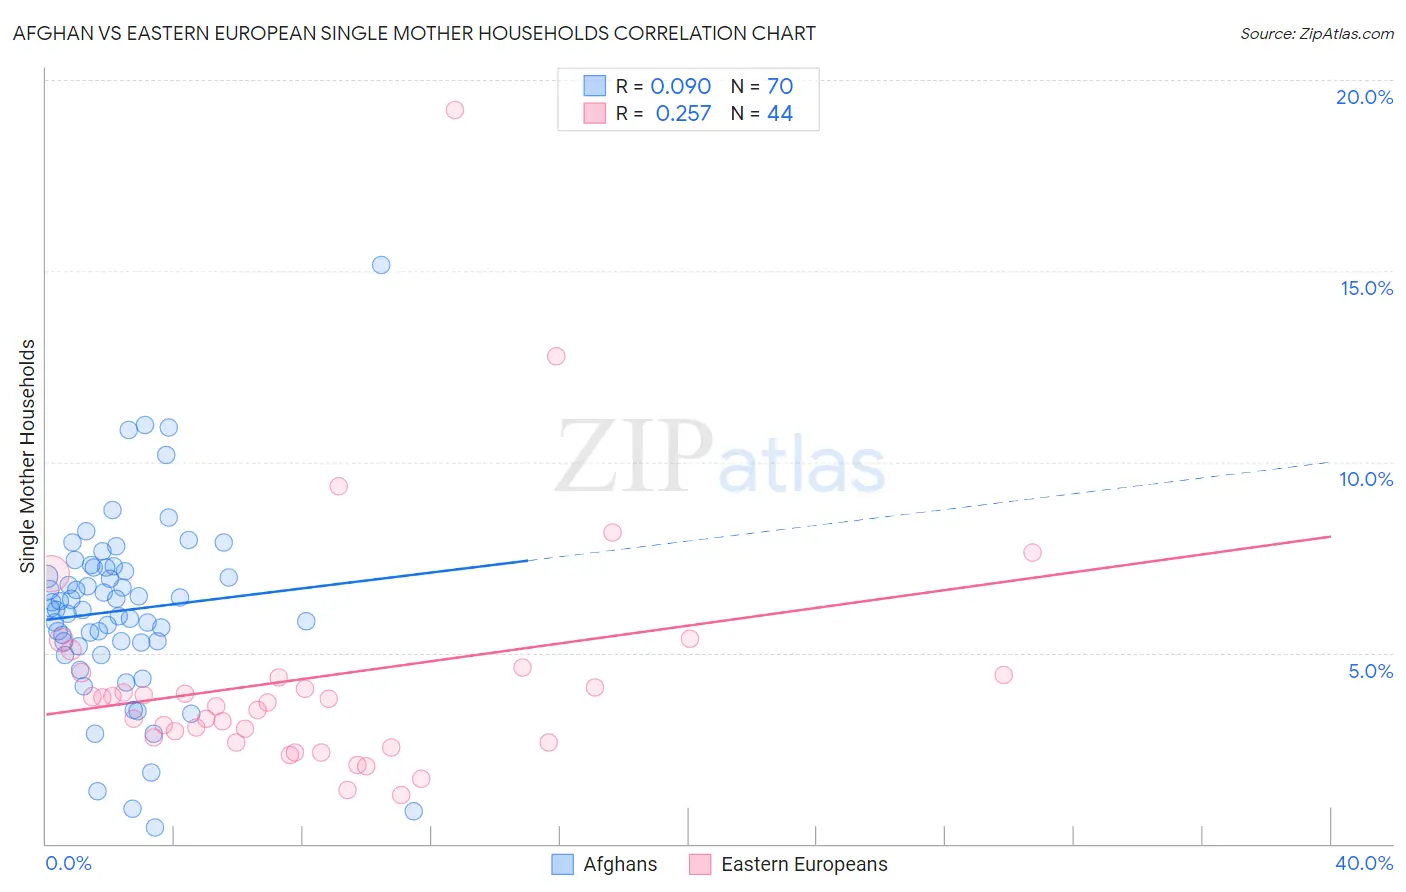
Afghan vs Eastern European Single Mother Households Correlation Chart
The statistical analysis conducted on geographies consisting of 148,722,502 people shows a slight positive correlation between the proportion of Afghans and percentage of single mother households in the United States with a correlation coefficient (R) of 0.090 and weighted average of 6.3%. Similarly, the statistical analysis conducted on geographies consisting of 459,026,965 people shows a weak positive correlation between the proportion of Eastern Europeans and percentage of single mother households in the United States with a correlation coefficient (R) of 0.257 and weighted average of 5.2%, a difference of 21.3%.
Single Mother Households Correlation Summary
| Measurement | Afghan | Eastern European |
| Minimum | 0.41% | 1.3% |
| Maximum | 15.1% | 19.2% |
| Range | 14.7% | 18.0% |
| Mean | 6.1% | 4.4% |
| Median | 6.1% | 3.8% |
| Interquartile 25% (IQ1) | 5.3% | 2.7% |
| Interquartile 75% (IQ3) | 7.2% | 4.5% |
| Interquartile Range (IQR) | 2.0% | 1.7% |
| Standard Deviation (Sample) | 2.4% | 3.1% |
| Standard Deviation (Population) | 2.4% | 3.1% |
Similar Demographics by Single Mother Households
Demographics Similar to Afghans by Single Mother Households
In terms of single mother households, the demographic groups most similar to Afghans are Immigrants from South Eastern Asia (6.3%, a difference of 0.040%), Immigrants from Vietnam (6.3%, a difference of 0.11%), Immigrants from Oceania (6.3%, a difference of 0.23%), Immigrants from Morocco (6.3%, a difference of 0.28%), and Puget Sound Salish (6.3%, a difference of 0.63%).
| Demographics | Rating | Rank | Single Mother Households |
| Immigrants | Northern Africa | 68.0 /100 | #164 | Good 6.2% |
| Immigrants | Syria | 67.4 /100 | #165 | Good 6.2% |
| Sri Lankans | 63.9 /100 | #166 | Good 6.2% |
| Brazilians | 59.1 /100 | #167 | Average 6.2% |
| Immigrants | Chile | 58.3 /100 | #168 | Average 6.3% |
| Puget Sound Salish | 58.1 /100 | #169 | Average 6.3% |
| Immigrants | Oceania | 54.6 /100 | #170 | Average 6.3% |
| Afghans | 52.5 /100 | #171 | Average 6.3% |
| Immigrants | South Eastern Asia | 52.2 /100 | #172 | Average 6.3% |
| Immigrants | Vietnam | 51.5 /100 | #173 | Average 6.3% |
| Immigrants | Morocco | 50.0 /100 | #174 | Average 6.3% |
| Marshallese | 45.8 /100 | #175 | Average 6.3% |
| Immigrants | Bosnia and Herzegovina | 44.3 /100 | #176 | Average 6.3% |
| Osage | 43.0 /100 | #177 | Average 6.4% |
| Portuguese | 40.0 /100 | #178 | Fair 6.4% |
Demographics Similar to Eastern Europeans by Single Mother Households
In terms of single mother households, the demographic groups most similar to Eastern Europeans are Maltese (5.2%, a difference of 0.060%), Chinese (5.2%, a difference of 0.53%), Immigrants from Armenia (5.2%, a difference of 0.63%), Thai (5.2%, a difference of 0.72%), and Immigrants from Austria (5.2%, a difference of 0.77%).
| Demographics | Rating | Rank | Single Mother Households |
| Immigrants | Australia | 99.9 /100 | #14 | Exceptional 5.1% |
| Immigrants | Eastern Asia | 99.9 /100 | #15 | Exceptional 5.1% |
| Indians (Asian) | 99.9 /100 | #16 | Exceptional 5.1% |
| Soviet Union | 99.9 /100 | #17 | Exceptional 5.1% |
| Immigrants | Armenia | 99.9 /100 | #18 | Exceptional 5.2% |
| Chinese | 99.9 /100 | #19 | Exceptional 5.2% |
| Maltese | 99.9 /100 | #20 | Exceptional 5.2% |
| Eastern Europeans | 99.8 /100 | #21 | Exceptional 5.2% |
| Thais | 99.8 /100 | #22 | Exceptional 5.2% |
| Immigrants | Austria | 99.8 /100 | #23 | Exceptional 5.2% |
| Armenians | 99.8 /100 | #24 | Exceptional 5.2% |
| Immigrants | Japan | 99.8 /100 | #25 | Exceptional 5.2% |
| Immigrants | Lithuania | 99.8 /100 | #26 | Exceptional 5.3% |
| Bhutanese | 99.7 /100 | #27 | Exceptional 5.3% |
| Russians | 99.7 /100 | #28 | Exceptional 5.3% |