Spanish vs Australian Single Mother Households
COMPARE
Spanish
Australian
Single Mother Households
Single Mother Households Comparison
Spanish
Australians
6.4%
SINGLE MOTHER HOUSEHOLDS
33.4/ 100
METRIC RATING
181st/ 347
METRIC RANK
5.6%
SINGLE MOTHER HOUSEHOLDS
98.7/ 100
METRIC RATING
61st/ 347
METRIC RANK
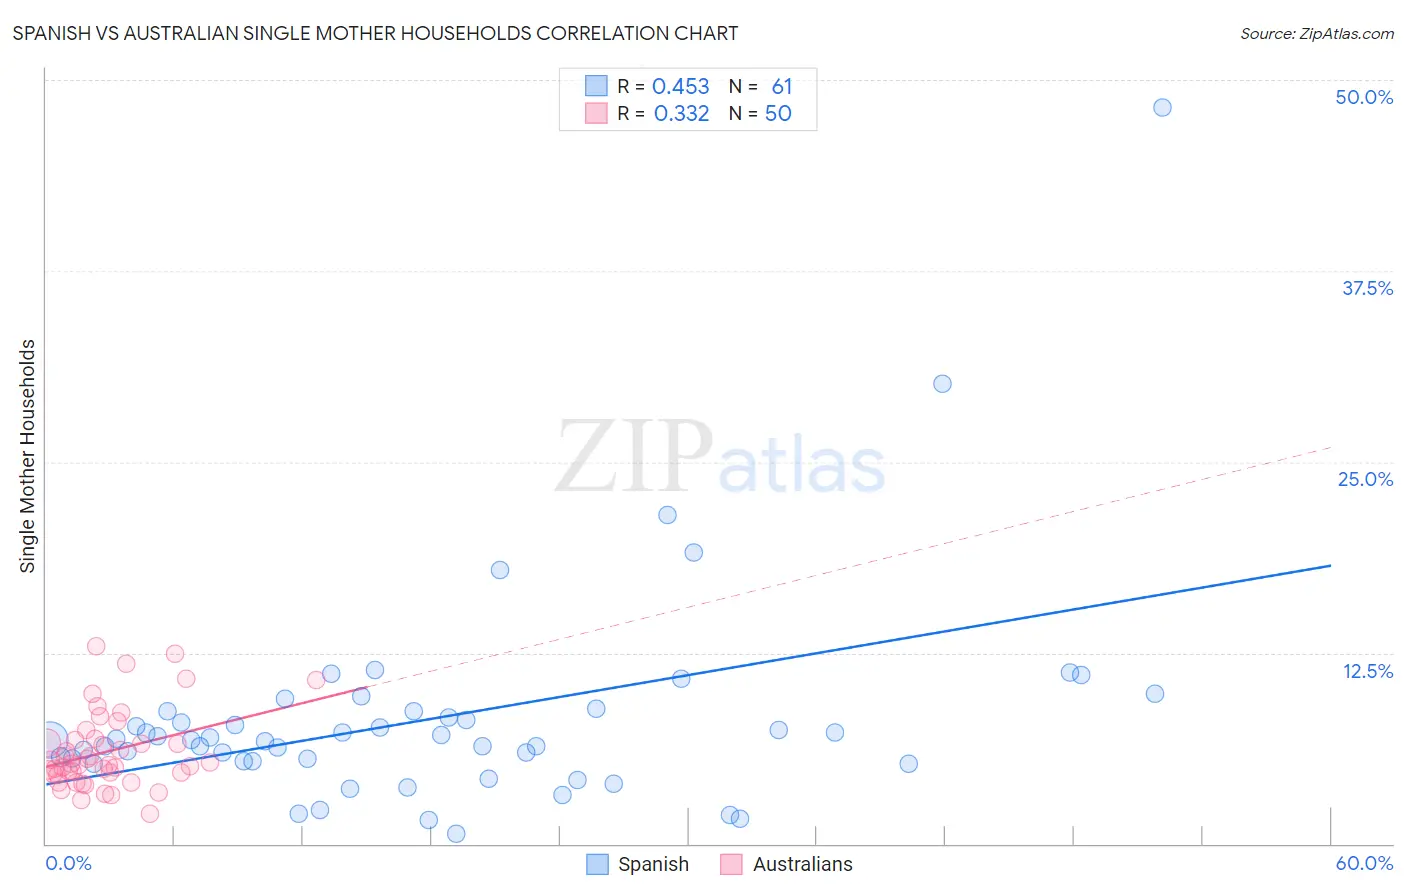
Spanish vs Australian Single Mother Households Correlation Chart
The statistical analysis conducted on geographies consisting of 420,668,605 people shows a moderate positive correlation between the proportion of Spanish and percentage of single mother households in the United States with a correlation coefficient (R) of 0.453 and weighted average of 6.4%. Similarly, the statistical analysis conducted on geographies consisting of 223,630,517 people shows a mild positive correlation between the proportion of Australians and percentage of single mother households in the United States with a correlation coefficient (R) of 0.332 and weighted average of 5.6%, a difference of 15.4%.
Single Mother Households Correlation Summary
| Measurement | Spanish | Australian |
| Minimum | 0.65% | 1.9% |
| Maximum | 48.2% | 12.9% |
| Range | 47.5% | 11.0% |
| Mean | 8.2% | 6.0% |
| Median | 6.8% | 5.2% |
| Interquartile 25% (IQ1) | 5.4% | 4.6% |
| Interquartile 75% (IQ3) | 8.7% | 6.8% |
| Interquartile Range (IQR) | 3.3% | 2.2% |
| Standard Deviation (Sample) | 7.1% | 2.5% |
| Standard Deviation (Population) | 7.0% | 2.5% |
Similar Demographics by Single Mother Households
Demographics Similar to Spanish by Single Mother Households
In terms of single mother households, the demographic groups most similar to Spanish are South American Indian (6.4%, a difference of 0.0%), Immigrants from Nepal (6.4%, a difference of 0.32%), Spaniard (6.5%, a difference of 0.71%), Hmong (6.4%, a difference of 0.74%), and Portuguese (6.4%, a difference of 0.77%).
| Demographics | Rating | Rank | Single Mother Households |
| Immigrants | Morocco | 50.0 /100 | #174 | Average 6.3% |
| Marshallese | 45.8 /100 | #175 | Average 6.3% |
| Immigrants | Bosnia and Herzegovina | 44.3 /100 | #176 | Average 6.3% |
| Osage | 43.0 /100 | #177 | Average 6.4% |
| Portuguese | 40.0 /100 | #178 | Fair 6.4% |
| Hmong | 39.8 /100 | #179 | Fair 6.4% |
| Immigrants | Nepal | 36.1 /100 | #180 | Fair 6.4% |
| Spanish | 33.4 /100 | #181 | Fair 6.4% |
| South American Indians | 33.4 /100 | #182 | Fair 6.4% |
| Spaniards | 27.8 /100 | #183 | Fair 6.5% |
| Ethiopians | 26.0 /100 | #184 | Fair 6.5% |
| Ugandans | 25.6 /100 | #185 | Fair 6.5% |
| Costa Ricans | 24.8 /100 | #186 | Fair 6.5% |
| Immigrants | Afghanistan | 24.7 /100 | #187 | Fair 6.5% |
| Ottawa | 23.8 /100 | #188 | Fair 6.5% |
Demographics Similar to Australians by Single Mother Households
In terms of single mother households, the demographic groups most similar to Australians are Polish (5.6%, a difference of 0.010%), Immigrants from Norway (5.6%, a difference of 0.070%), Immigrants from North Macedonia (5.6%, a difference of 0.080%), Immigrants from France (5.6%, a difference of 0.12%), and Greek (5.6%, a difference of 0.16%).
| Demographics | Rating | Rank | Single Mother Households |
| Immigrants | Lebanon | 99.1 /100 | #54 | Exceptional 5.5% |
| Immigrants | Denmark | 99.1 /100 | #55 | Exceptional 5.5% |
| Immigrants | Romania | 99.0 /100 | #56 | Exceptional 5.5% |
| Immigrants | Europe | 99.0 /100 | #57 | Exceptional 5.5% |
| Danes | 98.9 /100 | #58 | Exceptional 5.5% |
| Luxembourgers | 98.7 /100 | #59 | Exceptional 5.6% |
| Immigrants | Norway | 98.7 /100 | #60 | Exceptional 5.6% |
| Australians | 98.7 /100 | #61 | Exceptional 5.6% |
| Poles | 98.6 /100 | #62 | Exceptional 5.6% |
| Immigrants | North Macedonia | 98.6 /100 | #63 | Exceptional 5.6% |
| Immigrants | France | 98.6 /100 | #64 | Exceptional 5.6% |
| Greeks | 98.6 /100 | #65 | Exceptional 5.6% |
| Immigrants | Canada | 98.5 /100 | #66 | Exceptional 5.6% |
| Italians | 98.5 /100 | #67 | Exceptional 5.6% |
| Immigrants | Bulgaria | 98.5 /100 | #68 | Exceptional 5.6% |