Spanish vs South American Indian Single Mother Households
COMPARE
Spanish
South American Indian
Single Mother Households
Single Mother Households Comparison
Spanish
South American Indians
6.4%
SINGLE MOTHER HOUSEHOLDS
33.4/ 100
METRIC RATING
181st/ 347
METRIC RANK
6.4%
SINGLE MOTHER HOUSEHOLDS
33.4/ 100
METRIC RATING
182nd/ 347
METRIC RANK
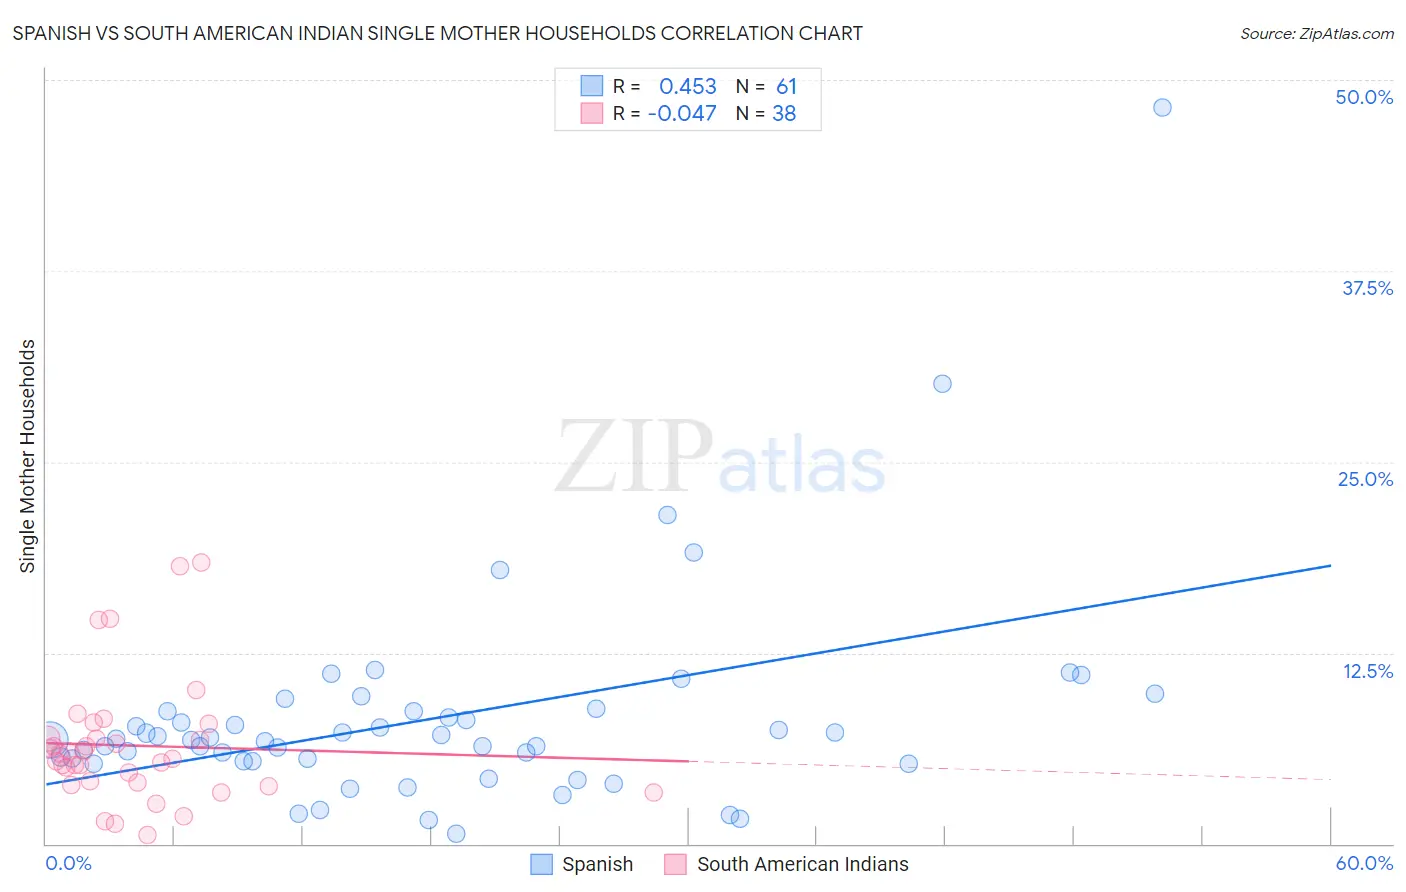
Spanish vs South American Indian Single Mother Households Correlation Chart
The statistical analysis conducted on geographies consisting of 420,668,605 people shows a moderate positive correlation between the proportion of Spanish and percentage of single mother households in the United States with a correlation coefficient (R) of 0.453 and weighted average of 6.4%. Similarly, the statistical analysis conducted on geographies consisting of 164,464,309 people shows no correlation between the proportion of South American Indians and percentage of single mother households in the United States with a correlation coefficient (R) of -0.047 and weighted average of 6.4%, a difference of 0.0%.
Single Mother Households Correlation Summary
| Measurement | Spanish | South American Indian |
| Minimum | 0.65% | 0.55% |
| Maximum | 48.2% | 18.4% |
| Range | 47.5% | 17.9% |
| Mean | 8.2% | 6.4% |
| Median | 6.8% | 5.7% |
| Interquartile 25% (IQ1) | 5.4% | 4.0% |
| Interquartile 75% (IQ3) | 8.7% | 6.9% |
| Interquartile Range (IQR) | 3.3% | 2.9% |
| Standard Deviation (Sample) | 7.1% | 4.1% |
| Standard Deviation (Population) | 7.0% | 4.0% |
Demographics Similar to Spanish and South American Indians by Single Mother Households
In terms of single mother households, the demographic groups most similar to Spanish are Immigrants from Nepal (6.4%, a difference of 0.32%), Spaniard (6.5%, a difference of 0.71%), Hmong (6.4%, a difference of 0.74%), Portuguese (6.4%, a difference of 0.77%), and Ethiopian (6.5%, a difference of 0.95%). Similarly, the demographic groups most similar to South American Indians are Immigrants from Nepal (6.4%, a difference of 0.32%), Spaniard (6.5%, a difference of 0.70%), Hmong (6.4%, a difference of 0.75%), Portuguese (6.4%, a difference of 0.77%), and Ethiopian (6.5%, a difference of 0.95%).
| Demographics | Rating | Rank | Single Mother Households |
| Afghans | 52.5 /100 | #171 | Average 6.3% |
| Immigrants | South Eastern Asia | 52.2 /100 | #172 | Average 6.3% |
| Immigrants | Vietnam | 51.5 /100 | #173 | Average 6.3% |
| Immigrants | Morocco | 50.0 /100 | #174 | Average 6.3% |
| Marshallese | 45.8 /100 | #175 | Average 6.3% |
| Immigrants | Bosnia and Herzegovina | 44.3 /100 | #176 | Average 6.3% |
| Osage | 43.0 /100 | #177 | Average 6.4% |
| Portuguese | 40.0 /100 | #178 | Fair 6.4% |
| Hmong | 39.8 /100 | #179 | Fair 6.4% |
| Immigrants | Nepal | 36.1 /100 | #180 | Fair 6.4% |
| Spanish | 33.4 /100 | #181 | Fair 6.4% |
| South American Indians | 33.4 /100 | #182 | Fair 6.4% |
| Spaniards | 27.8 /100 | #183 | Fair 6.5% |
| Ethiopians | 26.0 /100 | #184 | Fair 6.5% |
| Ugandans | 25.6 /100 | #185 | Fair 6.5% |
| Costa Ricans | 24.8 /100 | #186 | Fair 6.5% |
| Immigrants | Afghanistan | 24.7 /100 | #187 | Fair 6.5% |
| Ottawa | 23.8 /100 | #188 | Fair 6.5% |
| Delaware | 23.3 /100 | #189 | Fair 6.5% |
| Peruvians | 21.6 /100 | #190 | Fair 6.5% |
| Samoans | 21.2 /100 | #191 | Fair 6.5% |