Spanish vs Eastern European High School Diploma
COMPARE
Spanish
Eastern European
High School Diploma
High School Diploma Comparison
Spanish
Eastern Europeans
89.2%
HIGH SCHOOL DIPLOMA
52.9/ 100
METRIC RATING
171st/ 347
METRIC RANK
91.9%
HIGH SCHOOL DIPLOMA
100.0/ 100
METRIC RATING
11th/ 347
METRIC RANK
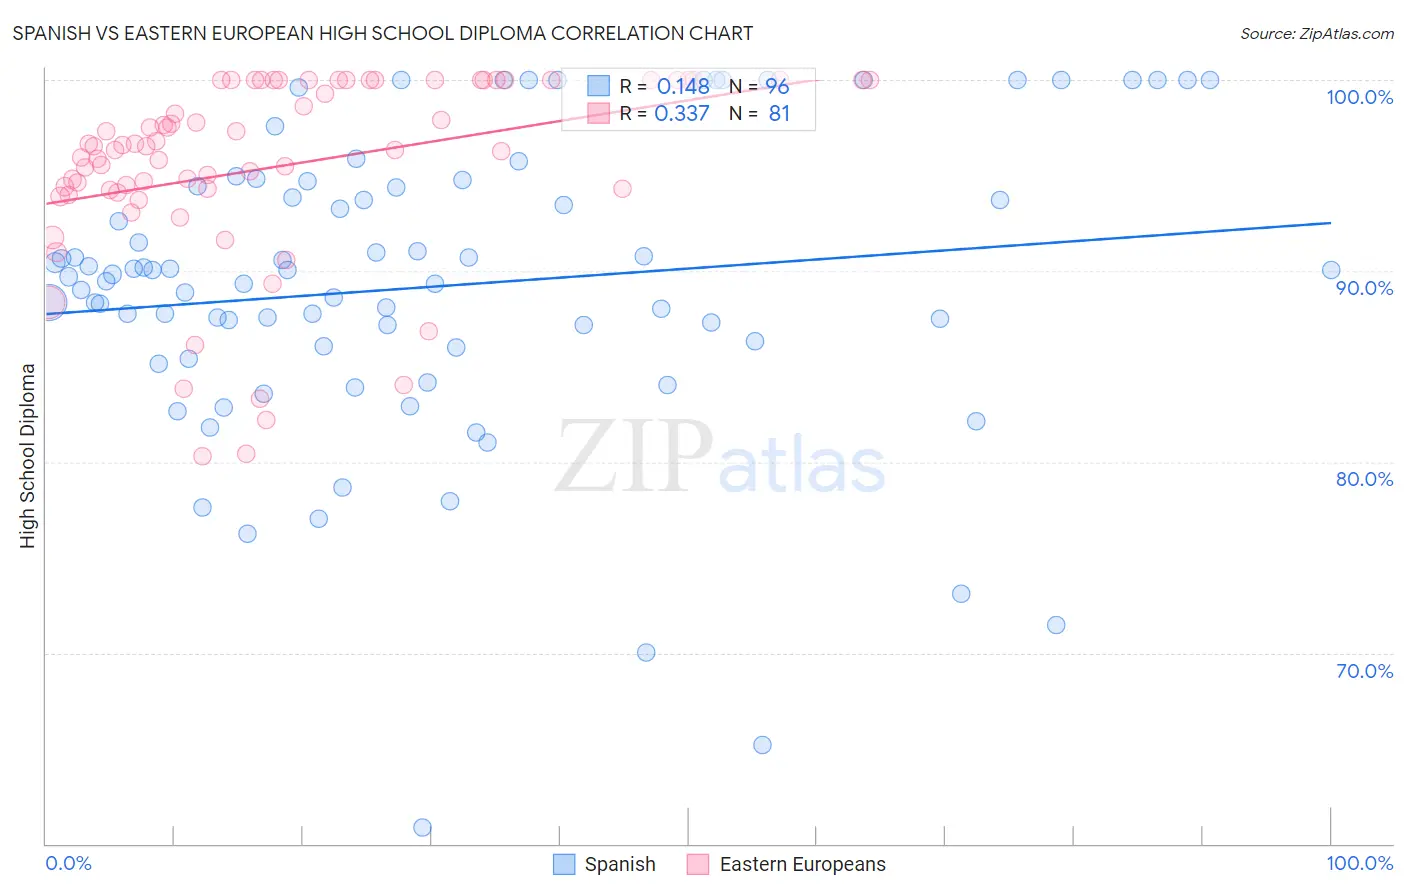
Spanish vs Eastern European High School Diploma Correlation Chart
The statistical analysis conducted on geographies consisting of 422,189,152 people shows a poor positive correlation between the proportion of Spanish and percentage of population with at least high school diploma education in the United States with a correlation coefficient (R) of 0.148 and weighted average of 89.2%. Similarly, the statistical analysis conducted on geographies consisting of 461,247,615 people shows a mild positive correlation between the proportion of Eastern Europeans and percentage of population with at least high school diploma education in the United States with a correlation coefficient (R) of 0.337 and weighted average of 91.9%, a difference of 3.0%.
High School Diploma Correlation Summary
| Measurement | Spanish | Eastern European |
| Minimum | 60.9% | 80.3% |
| Maximum | 100.0% | 100.0% |
| Range | 39.1% | 19.7% |
| Mean | 89.2% | 95.5% |
| Median | 89.8% | 96.5% |
| Interquartile 25% (IQ1) | 86.0% | 94.2% |
| Interquartile 75% (IQ3) | 94.4% | 100.0% |
| Interquartile Range (IQR) | 8.4% | 5.8% |
| Standard Deviation (Sample) | 7.9% | 5.0% |
| Standard Deviation (Population) | 7.8% | 4.9% |
Similar Demographics by High School Diploma
Demographics Similar to Spanish by High School Diploma
In terms of high school diploma, the demographic groups most similar to Spanish are Immigrants from Morocco (89.2%, a difference of 0.010%), Nonimmigrants (89.2%, a difference of 0.020%), Iroquois (89.2%, a difference of 0.030%), Delaware (89.2%, a difference of 0.040%), and Immigrants from Indonesia (89.1%, a difference of 0.040%).
| Demographics | Rating | Rank | High School Diploma |
| Immigrants | Nepal | 61.1 /100 | #164 | Good 89.3% |
| Immigrants | Asia | 59.8 /100 | #165 | Average 89.3% |
| Immigrants | Albania | 59.4 /100 | #166 | Average 89.3% |
| Immigrants | Hong Kong | 58.6 /100 | #167 | Average 89.3% |
| Delaware | 55.8 /100 | #168 | Average 89.2% |
| Iroquois | 55.1 /100 | #169 | Average 89.2% |
| Immigrants | Morocco | 53.3 /100 | #170 | Average 89.2% |
| Spanish | 52.9 /100 | #171 | Average 89.2% |
| Immigrants | Nonimmigrants | 51.8 /100 | #172 | Average 89.2% |
| Immigrants | Indonesia | 50.3 /100 | #173 | Average 89.1% |
| Hmong | 50.0 /100 | #174 | Average 89.1% |
| Immigrants | Western Asia | 49.0 /100 | #175 | Average 89.1% |
| Osage | 48.9 /100 | #176 | Average 89.1% |
| Sudanese | 48.5 /100 | #177 | Average 89.1% |
| Sierra Leoneans | 48.4 /100 | #178 | Average 89.1% |
Demographics Similar to Eastern Europeans by High School Diploma
In terms of high school diploma, the demographic groups most similar to Eastern Europeans are Polish (91.9%, a difference of 0.050%), Croatian (92.0%, a difference of 0.070%), Danish (91.8%, a difference of 0.090%), Latvian (92.0%, a difference of 0.10%), and Chinese (92.0%, a difference of 0.11%).
| Demographics | Rating | Rank | High School Diploma |
| Lithuanians | 100.0 /100 | #4 | Exceptional 92.0% |
| Slovenes | 100.0 /100 | #5 | Exceptional 92.0% |
| Slovaks | 100.0 /100 | #6 | Exceptional 92.0% |
| Immigrants | India | 100.0 /100 | #7 | Exceptional 92.0% |
| Chinese | 100.0 /100 | #8 | Exceptional 92.0% |
| Latvians | 100.0 /100 | #9 | Exceptional 92.0% |
| Croatians | 100.0 /100 | #10 | Exceptional 92.0% |
| Eastern Europeans | 100.0 /100 | #11 | Exceptional 91.9% |
| Poles | 100.0 /100 | #12 | Exceptional 91.9% |
| Danes | 100.0 /100 | #13 | Exceptional 91.8% |
| Bulgarians | 100.0 /100 | #14 | Exceptional 91.8% |
| Luxembourgers | 100.0 /100 | #15 | Exceptional 91.7% |
| Finns | 100.0 /100 | #16 | Exceptional 91.7% |
| Immigrants | Singapore | 99.9 /100 | #17 | Exceptional 91.7% |
| Germans | 99.9 /100 | #18 | Exceptional 91.7% |