Immigrants from Bahamas vs Australian Single Mother Households
COMPARE
Immigrants from Bahamas
Australian
Single Mother Households
Single Mother Households Comparison
Immigrants from Bahamas
Australians
8.0%
SINGLE MOTHER HOUSEHOLDS
0.0/ 100
METRIC RATING
303rd/ 347
METRIC RANK
5.6%
SINGLE MOTHER HOUSEHOLDS
98.7/ 100
METRIC RATING
61st/ 347
METRIC RANK
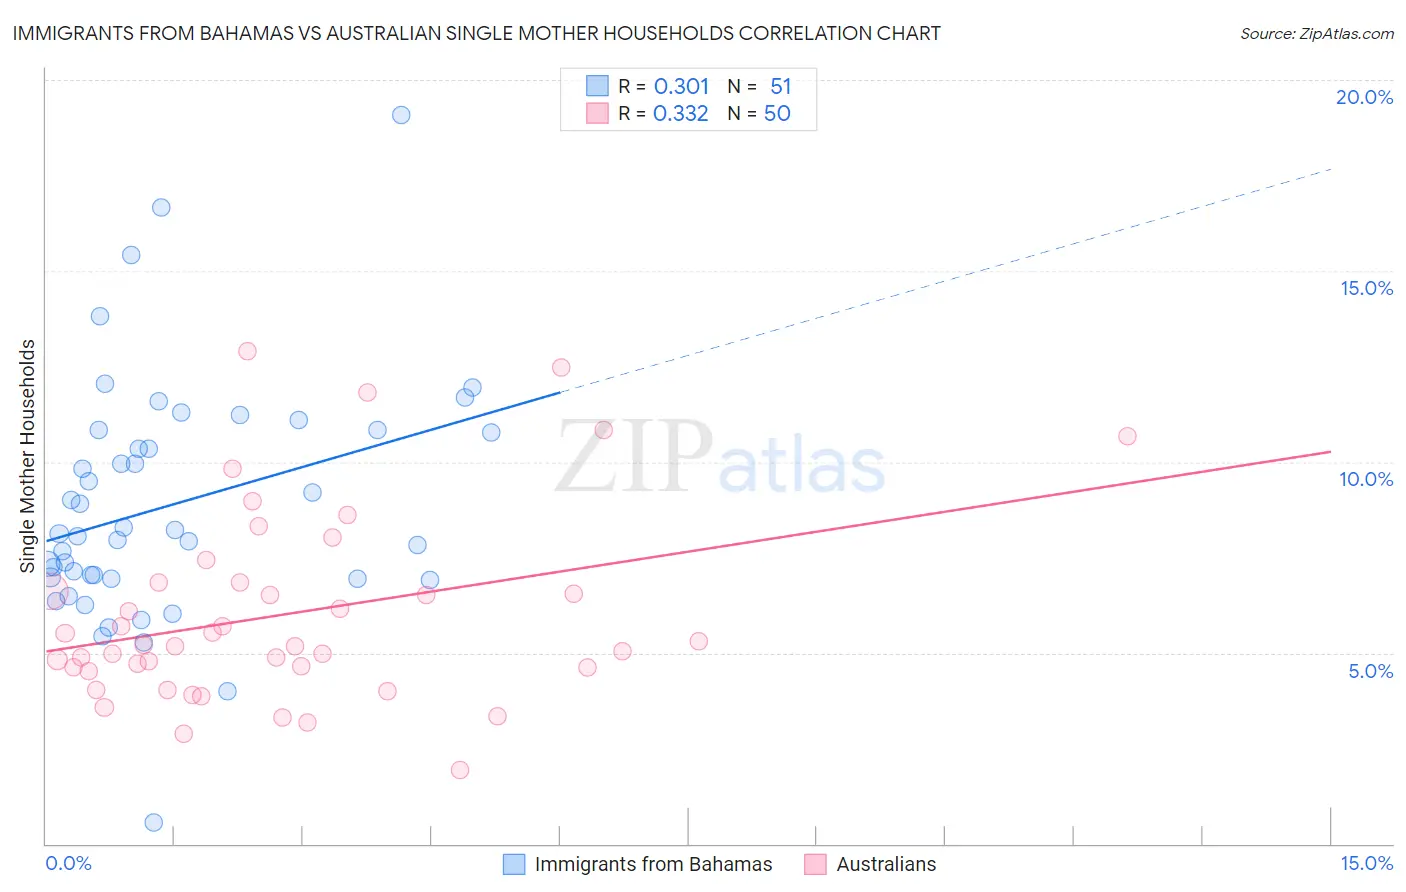
Immigrants from Bahamas vs Australian Single Mother Households Correlation Chart
The statistical analysis conducted on geographies consisting of 104,574,907 people shows a mild positive correlation between the proportion of Immigrants from Bahamas and percentage of single mother households in the United States with a correlation coefficient (R) of 0.301 and weighted average of 8.0%. Similarly, the statistical analysis conducted on geographies consisting of 223,630,517 people shows a mild positive correlation between the proportion of Australians and percentage of single mother households in the United States with a correlation coefficient (R) of 0.332 and weighted average of 5.6%, a difference of 43.4%.
Single Mother Households Correlation Summary
| Measurement | Immigrants from Bahamas | Australian |
| Minimum | 0.57% | 1.9% |
| Maximum | 19.1% | 12.9% |
| Range | 18.5% | 11.0% |
| Mean | 8.9% | 6.0% |
| Median | 8.1% | 5.2% |
| Interquartile 25% (IQ1) | 6.9% | 4.6% |
| Interquartile 75% (IQ3) | 10.8% | 6.8% |
| Interquartile Range (IQR) | 3.9% | 2.2% |
| Standard Deviation (Sample) | 3.2% | 2.5% |
| Standard Deviation (Population) | 3.1% | 2.5% |
Similar Demographics by Single Mother Households
Demographics Similar to Immigrants from Bahamas by Single Mother Households
In terms of single mother households, the demographic groups most similar to Immigrants from Bahamas are Immigrants from Ghana (8.0%, a difference of 0.020%), Chippewa (8.0%, a difference of 0.12%), Mexican (8.0%, a difference of 0.27%), Native/Alaskan (8.0%, a difference of 0.44%), and Colville (8.0%, a difference of 0.49%).
| Demographics | Rating | Rank | Single Mother Households |
| Immigrants | Latin America | 0.0 /100 | #296 | Tragic 7.9% |
| Hispanics or Latinos | 0.0 /100 | #297 | Tragic 7.9% |
| Immigrants | West Indies | 0.0 /100 | #298 | Tragic 7.9% |
| Houma | 0.0 /100 | #299 | Tragic 7.9% |
| Mexicans | 0.0 /100 | #300 | Tragic 8.0% |
| Chippewa | 0.0 /100 | #301 | Tragic 8.0% |
| Immigrants | Ghana | 0.0 /100 | #302 | Tragic 8.0% |
| Immigrants | Bahamas | 0.0 /100 | #303 | Tragic 8.0% |
| Natives/Alaskans | 0.0 /100 | #304 | Tragic 8.0% |
| Colville | 0.0 /100 | #305 | Tragic 8.0% |
| Immigrants | Barbados | 0.0 /100 | #306 | Tragic 8.0% |
| Immigrants | St. Vincent and the Grenadines | 0.0 /100 | #307 | Tragic 8.0% |
| Immigrants | Central America | 0.0 /100 | #308 | Tragic 8.1% |
| Cheyenne | 0.0 /100 | #309 | Tragic 8.1% |
| Hondurans | 0.0 /100 | #310 | Tragic 8.1% |
Demographics Similar to Australians by Single Mother Households
In terms of single mother households, the demographic groups most similar to Australians are Polish (5.6%, a difference of 0.010%), Immigrants from Norway (5.6%, a difference of 0.070%), Immigrants from North Macedonia (5.6%, a difference of 0.080%), Immigrants from France (5.6%, a difference of 0.12%), and Greek (5.6%, a difference of 0.16%).
| Demographics | Rating | Rank | Single Mother Households |
| Immigrants | Lebanon | 99.1 /100 | #54 | Exceptional 5.5% |
| Immigrants | Denmark | 99.1 /100 | #55 | Exceptional 5.5% |
| Immigrants | Romania | 99.0 /100 | #56 | Exceptional 5.5% |
| Immigrants | Europe | 99.0 /100 | #57 | Exceptional 5.5% |
| Danes | 98.9 /100 | #58 | Exceptional 5.5% |
| Luxembourgers | 98.7 /100 | #59 | Exceptional 5.6% |
| Immigrants | Norway | 98.7 /100 | #60 | Exceptional 5.6% |
| Australians | 98.7 /100 | #61 | Exceptional 5.6% |
| Poles | 98.6 /100 | #62 | Exceptional 5.6% |
| Immigrants | North Macedonia | 98.6 /100 | #63 | Exceptional 5.6% |
| Immigrants | France | 98.6 /100 | #64 | Exceptional 5.6% |
| Greeks | 98.6 /100 | #65 | Exceptional 5.6% |
| Immigrants | Canada | 98.5 /100 | #66 | Exceptional 5.6% |
| Italians | 98.5 /100 | #67 | Exceptional 5.6% |
| Immigrants | Bulgaria | 98.5 /100 | #68 | Exceptional 5.6% |