Salvadoran vs Trinidadian and Tobagonian Currently Married
COMPARE
Salvadoran
Trinidadian and Tobagonian
Currently Married
Currently Married Comparison
Salvadorans
Trinidadians and Tobagonians
43.5%
CURRENTLY MARRIED
0.1/ 100
METRIC RATING
270th/ 347
METRIC RANK
41.5%
CURRENTLY MARRIED
0.0/ 100
METRIC RATING
311th/ 347
METRIC RANK
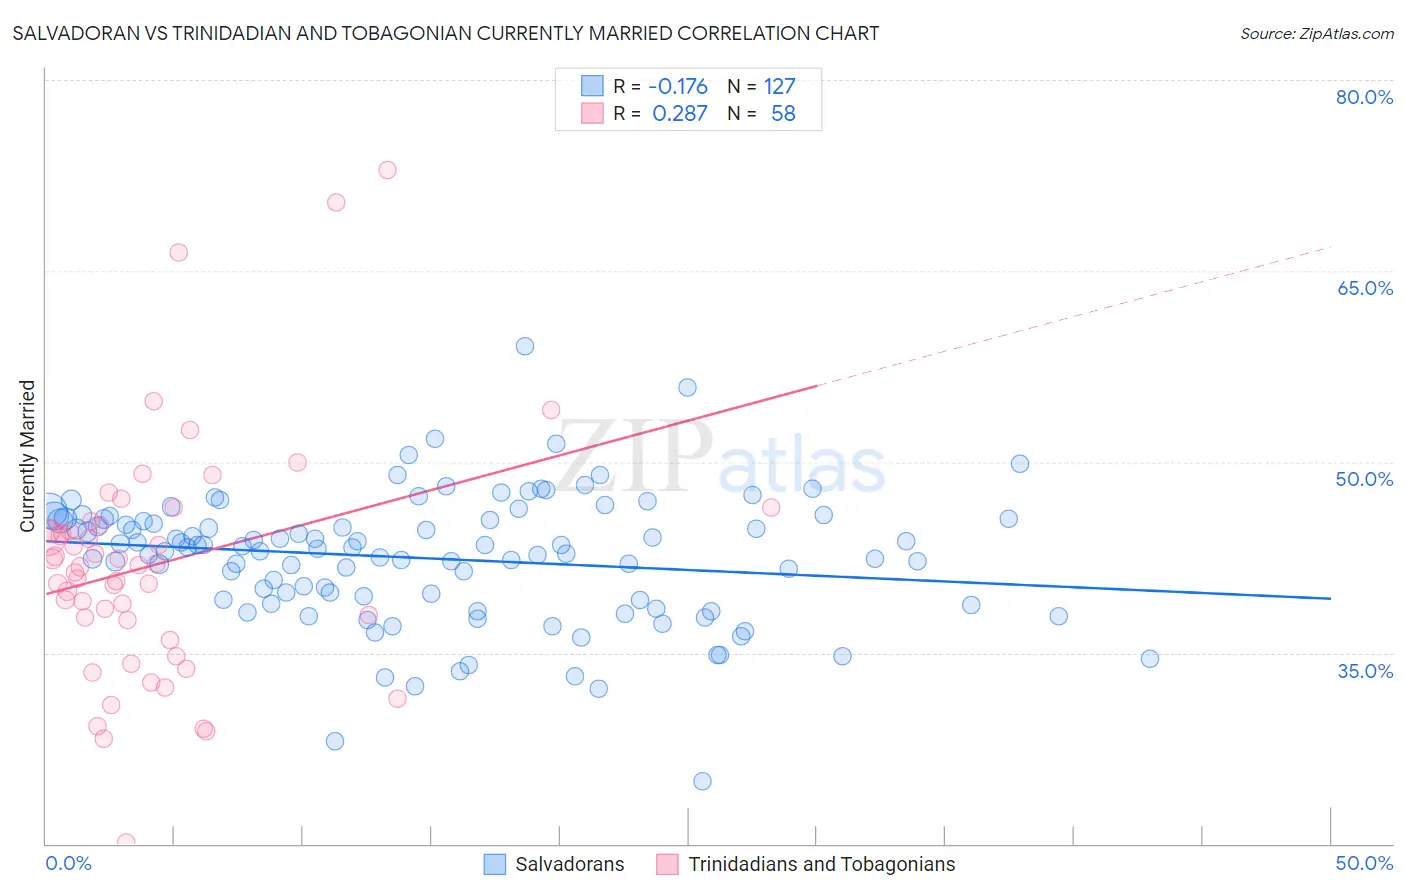
Salvadoran vs Trinidadian and Tobagonian Currently Married Correlation Chart
The statistical analysis conducted on geographies consisting of 399,003,710 people shows a poor negative correlation between the proportion of Salvadorans and percentage of population currently married in the United States with a correlation coefficient (R) of -0.176 and weighted average of 43.5%. Similarly, the statistical analysis conducted on geographies consisting of 219,846,005 people shows a weak positive correlation between the proportion of Trinidadians and Tobagonians and percentage of population currently married in the United States with a correlation coefficient (R) of 0.287 and weighted average of 41.5%, a difference of 4.7%.
Currently Married Correlation Summary
| Measurement | Salvadoran | Trinidadian and Tobagonian |
| Minimum | 24.9% | 20.1% |
| Maximum | 59.1% | 72.9% |
| Range | 34.2% | 52.8% |
| Mean | 42.4% | 41.9% |
| Median | 43.2% | 41.8% |
| Interquartile 25% (IQ1) | 39.1% | 37.6% |
| Interquartile 75% (IQ3) | 45.5% | 45.0% |
| Interquartile Range (IQR) | 6.4% | 7.5% |
| Standard Deviation (Sample) | 5.1% | 9.4% |
| Standard Deviation (Population) | 5.0% | 9.4% |
Similar Demographics by Currently Married
Demographics Similar to Salvadorans by Currently Married
In terms of currently married, the demographic groups most similar to Salvadorans are Bermudan (43.5%, a difference of 0.020%), Indonesian (43.5%, a difference of 0.050%), Immigrants from Sudan (43.5%, a difference of 0.080%), Yaqui (43.4%, a difference of 0.10%), and Nigerian (43.4%, a difference of 0.11%).
| Demographics | Rating | Rank | Currently Married |
| Immigrants | Cuba | 0.1 /100 | #263 | Tragic 43.7% |
| Sudanese | 0.1 /100 | #264 | Tragic 43.7% |
| Immigrants | Bangladesh | 0.1 /100 | #265 | Tragic 43.6% |
| Ecuadorians | 0.1 /100 | #266 | Tragic 43.6% |
| Immigrants | Eritrea | 0.1 /100 | #267 | Tragic 43.6% |
| Spanish American Indians | 0.1 /100 | #268 | Tragic 43.6% |
| Immigrants | Sudan | 0.1 /100 | #269 | Tragic 43.5% |
| Salvadorans | 0.1 /100 | #270 | Tragic 43.5% |
| Bermudans | 0.1 /100 | #271 | Tragic 43.5% |
| Indonesians | 0.1 /100 | #272 | Tragic 43.5% |
| Yaqui | 0.1 /100 | #273 | Tragic 43.4% |
| Nigerians | 0.1 /100 | #274 | Tragic 43.4% |
| Colville | 0.1 /100 | #275 | Tragic 43.4% |
| Sierra Leoneans | 0.1 /100 | #276 | Tragic 43.4% |
| Immigrants | Nigeria | 0.1 /100 | #277 | Tragic 43.4% |
Demographics Similar to Trinidadians and Tobagonians by Currently Married
In terms of currently married, the demographic groups most similar to Trinidadians and Tobagonians are Guyanese (41.6%, a difference of 0.15%), Somali (41.5%, a difference of 0.18%), Jamaican (41.4%, a difference of 0.47%), Immigrants from Liberia (41.8%, a difference of 0.51%), and West Indian (41.3%, a difference of 0.55%).
| Demographics | Rating | Rank | Currently Married |
| Immigrants | Bahamas | 0.0 /100 | #304 | Tragic 41.9% |
| Immigrants | Trinidad and Tobago | 0.0 /100 | #305 | Tragic 41.9% |
| Immigrants | Guyana | 0.0 /100 | #306 | Tragic 41.9% |
| Africans | 0.0 /100 | #307 | Tragic 41.8% |
| Immigrants | Belize | 0.0 /100 | #308 | Tragic 41.8% |
| Immigrants | Liberia | 0.0 /100 | #309 | Tragic 41.8% |
| Guyanese | 0.0 /100 | #310 | Tragic 41.6% |
| Trinidadians and Tobagonians | 0.0 /100 | #311 | Tragic 41.5% |
| Somalis | 0.0 /100 | #312 | Tragic 41.5% |
| Jamaicans | 0.0 /100 | #313 | Tragic 41.4% |
| West Indians | 0.0 /100 | #314 | Tragic 41.3% |
| Inupiat | 0.0 /100 | #315 | Tragic 41.3% |
| Immigrants | Caribbean | 0.0 /100 | #316 | Tragic 41.3% |
| Haitians | 0.0 /100 | #317 | Tragic 41.3% |
| Bahamians | 0.0 /100 | #318 | Tragic 41.2% |