Seminole vs Ghanaian Currently Married
COMPARE
Seminole
Ghanaian
Currently Married
Currently Married Comparison
Seminole
Ghanaians
44.6%
CURRENTLY MARRIED
0.9/ 100
METRIC RATING
237th/ 347
METRIC RANK
42.9%
CURRENTLY MARRIED
0.0/ 100
METRIC RATING
286th/ 347
METRIC RANK
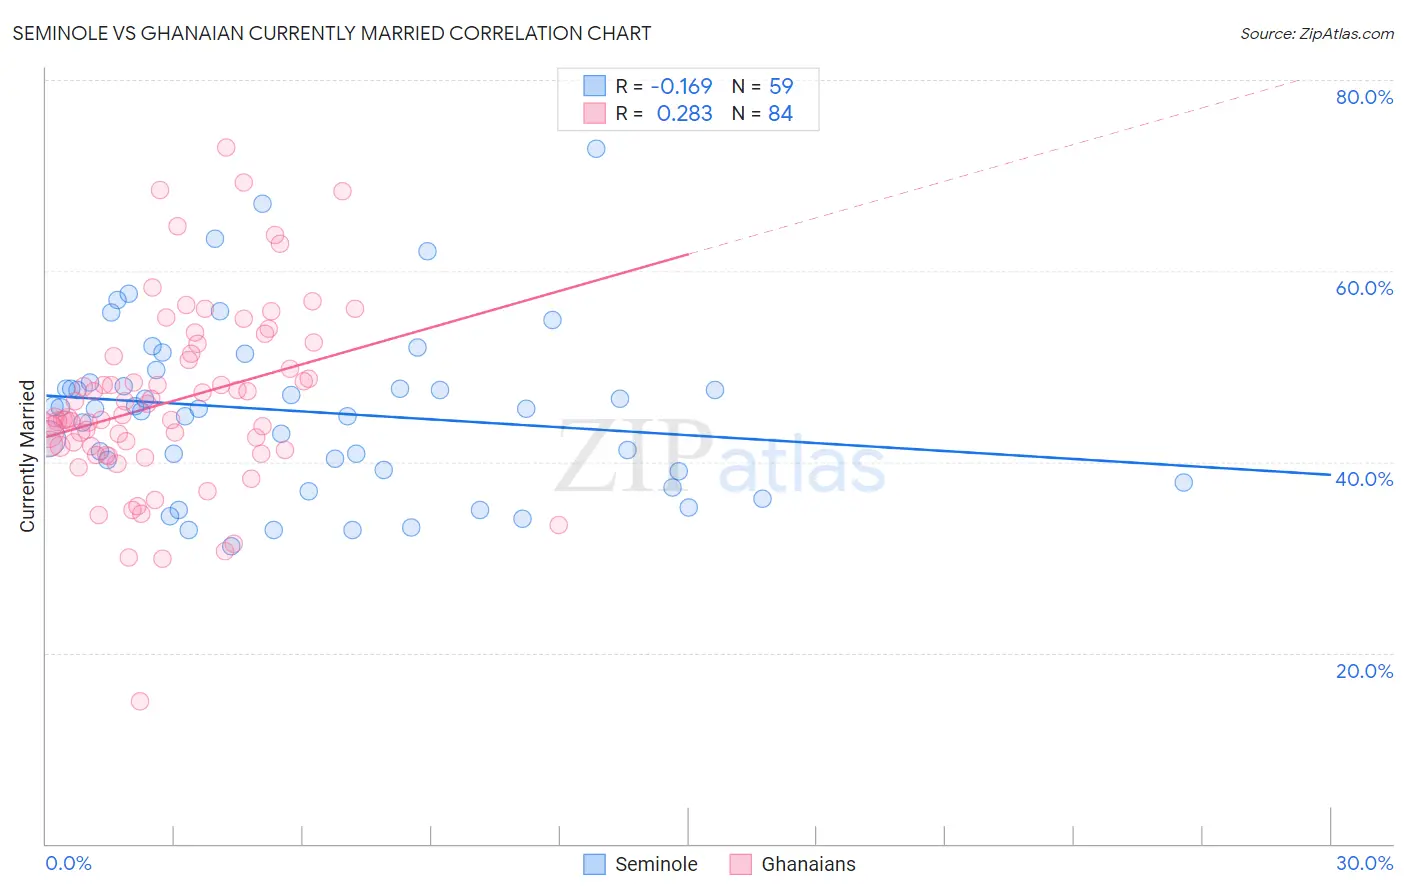
Seminole vs Ghanaian Currently Married Correlation Chart
The statistical analysis conducted on geographies consisting of 118,313,136 people shows a poor negative correlation between the proportion of Seminole and percentage of population currently married in the United States with a correlation coefficient (R) of -0.169 and weighted average of 44.6%. Similarly, the statistical analysis conducted on geographies consisting of 190,682,082 people shows a weak positive correlation between the proportion of Ghanaians and percentage of population currently married in the United States with a correlation coefficient (R) of 0.283 and weighted average of 42.9%, a difference of 4.0%.
Currently Married Correlation Summary
| Measurement | Seminole | Ghanaian |
| Minimum | 31.2% | 14.9% |
| Maximum | 72.8% | 72.9% |
| Range | 41.6% | 58.0% |
| Mean | 45.3% | 46.3% |
| Median | 45.6% | 44.6% |
| Interquartile 25% (IQ1) | 39.0% | 41.5% |
| Interquartile 75% (IQ3) | 48.3% | 51.2% |
| Interquartile Range (IQR) | 9.3% | 9.8% |
| Standard Deviation (Sample) | 8.9% | 9.6% |
| Standard Deviation (Population) | 8.8% | 9.6% |
Similar Demographics by Currently Married
Demographics Similar to Seminole by Currently Married
In terms of currently married, the demographic groups most similar to Seminole are Cuban (44.6%, a difference of 0.0%), Alaskan Athabascan (44.6%, a difference of 0.010%), Moroccan (44.6%, a difference of 0.080%), Iroquois (44.7%, a difference of 0.17%), and Immigrants from Saudi Arabia (44.7%, a difference of 0.18%).
| Demographics | Rating | Rank | Currently Married |
| Immigrants | Kenya | 1.6 /100 | #230 | Tragic 44.9% |
| Immigrants | Panama | 1.5 /100 | #231 | Tragic 44.9% |
| Nepalese | 1.2 /100 | #232 | Tragic 44.7% |
| Immigrants | Saudi Arabia | 1.1 /100 | #233 | Tragic 44.7% |
| Iroquois | 1.1 /100 | #234 | Tragic 44.7% |
| Alaskan Athabascans | 0.9 /100 | #235 | Tragic 44.6% |
| Cubans | 0.9 /100 | #236 | Tragic 44.6% |
| Seminole | 0.9 /100 | #237 | Tragic 44.6% |
| Moroccans | 0.9 /100 | #238 | Tragic 44.6% |
| Immigrants | Mexico | 0.7 /100 | #239 | Tragic 44.5% |
| Mexican American Indians | 0.7 /100 | #240 | Tragic 44.5% |
| Ethiopians | 0.7 /100 | #241 | Tragic 44.5% |
| Immigrants | Cambodia | 0.7 /100 | #242 | Tragic 44.5% |
| Immigrants | Ethiopia | 0.7 /100 | #243 | Tragic 44.5% |
| Japanese | 0.6 /100 | #244 | Tragic 44.5% |
Demographics Similar to Ghanaians by Currently Married
In terms of currently married, the demographic groups most similar to Ghanaians are Guatemalan (42.9%, a difference of 0.020%), Immigrants from Middle Africa (43.0%, a difference of 0.13%), Native/Alaskan (42.8%, a difference of 0.29%), Paiute (42.7%, a difference of 0.52%), and Immigrants from El Salvador (43.1%, a difference of 0.53%).
| Demographics | Rating | Rank | Currently Married |
| Central American Indians | 0.0 /100 | #279 | Tragic 43.3% |
| Apache | 0.0 /100 | #280 | Tragic 43.2% |
| Chippewa | 0.0 /100 | #281 | Tragic 43.2% |
| Immigrants | Ecuador | 0.0 /100 | #282 | Tragic 43.2% |
| Kiowa | 0.0 /100 | #283 | Tragic 43.2% |
| Immigrants | El Salvador | 0.0 /100 | #284 | Tragic 43.1% |
| Immigrants | Middle Africa | 0.0 /100 | #285 | Tragic 43.0% |
| Ghanaians | 0.0 /100 | #286 | Tragic 42.9% |
| Guatemalans | 0.0 /100 | #287 | Tragic 42.9% |
| Natives/Alaskans | 0.0 /100 | #288 | Tragic 42.8% |
| Paiute | 0.0 /100 | #289 | Tragic 42.7% |
| Immigrants | Ghana | 0.0 /100 | #290 | Tragic 42.7% |
| Immigrants | Guatemala | 0.0 /100 | #291 | Tragic 42.6% |
| Sub-Saharan Africans | 0.0 /100 | #292 | Tragic 42.6% |
| Yuman | 0.0 /100 | #293 | Tragic 42.6% |