Afghan vs Ghanaian Currently Married
COMPARE
Afghan
Ghanaian
Currently Married
Currently Married Comparison
Afghans
Ghanaians
47.3%
CURRENTLY MARRIED
81.8/ 100
METRIC RATING
132nd/ 347
METRIC RANK
42.9%
CURRENTLY MARRIED
0.0/ 100
METRIC RATING
286th/ 347
METRIC RANK
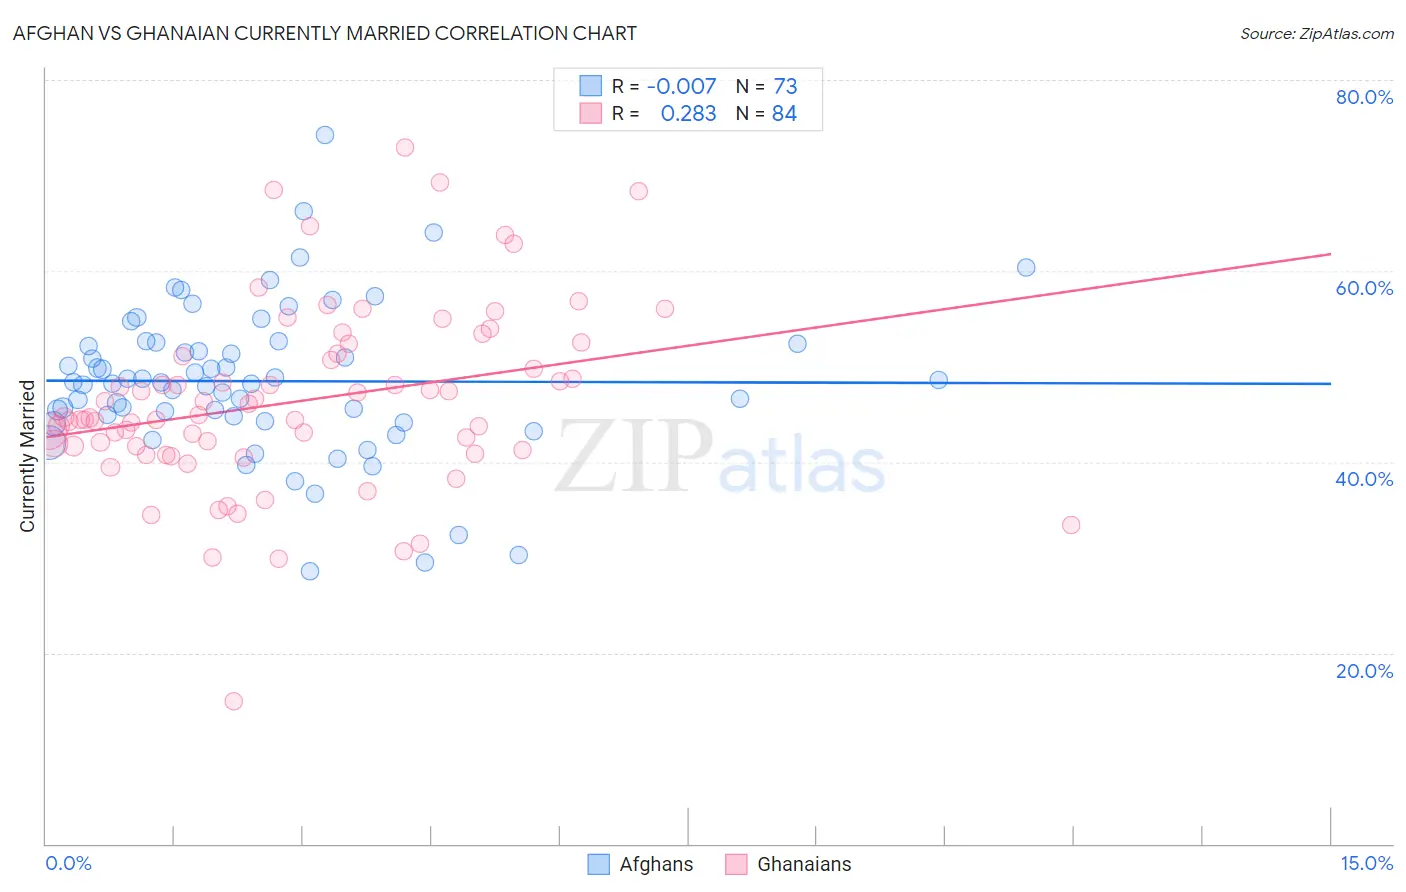
Afghan vs Ghanaian Currently Married Correlation Chart
The statistical analysis conducted on geographies consisting of 148,861,336 people shows no correlation between the proportion of Afghans and percentage of population currently married in the United States with a correlation coefficient (R) of -0.007 and weighted average of 47.3%. Similarly, the statistical analysis conducted on geographies consisting of 190,682,082 people shows a weak positive correlation between the proportion of Ghanaians and percentage of population currently married in the United States with a correlation coefficient (R) of 0.283 and weighted average of 42.9%, a difference of 10.1%.
Currently Married Correlation Summary
| Measurement | Afghan | Ghanaian |
| Minimum | 28.6% | 14.9% |
| Maximum | 74.2% | 72.9% |
| Range | 45.6% | 58.0% |
| Mean | 48.5% | 46.3% |
| Median | 48.3% | 44.6% |
| Interquartile 25% (IQ1) | 44.5% | 41.5% |
| Interquartile 75% (IQ3) | 52.5% | 51.2% |
| Interquartile Range (IQR) | 8.0% | 9.8% |
| Standard Deviation (Sample) | 8.0% | 9.6% |
| Standard Deviation (Population) | 7.9% | 9.6% |
Similar Demographics by Currently Married
Demographics Similar to Afghans by Currently Married
In terms of currently married, the demographic groups most similar to Afghans are Icelander (47.3%, a difference of 0.040%), Immigrants from Malaysia (47.3%, a difference of 0.040%), Immigrants from Australia (47.3%, a difference of 0.050%), Immigrants from Iraq (47.3%, a difference of 0.060%), and Sri Lankan (47.3%, a difference of 0.090%).
| Demographics | Rating | Rank | Currently Married |
| Okinawans | 85.3 /100 | #125 | Excellent 47.4% |
| Immigrants | Jordan | 84.9 /100 | #126 | Excellent 47.4% |
| New Zealanders | 84.9 /100 | #127 | Excellent 47.4% |
| Portuguese | 84.2 /100 | #128 | Excellent 47.3% |
| Sri Lankans | 83.2 /100 | #129 | Excellent 47.3% |
| Immigrants | Iraq | 82.8 /100 | #130 | Excellent 47.3% |
| Icelanders | 82.4 /100 | #131 | Excellent 47.3% |
| Afghans | 81.8 /100 | #132 | Excellent 47.3% |
| Immigrants | Malaysia | 81.1 /100 | #133 | Excellent 47.3% |
| Immigrants | Australia | 81.1 /100 | #134 | Excellent 47.3% |
| Immigrants | Norway | 79.7 /100 | #135 | Good 47.2% |
| Immigrants | Vietnam | 78.2 /100 | #136 | Good 47.2% |
| Paraguayans | 77.8 /100 | #137 | Good 47.2% |
| Pakistanis | 77.5 /100 | #138 | Good 47.2% |
| Yugoslavians | 77.4 /100 | #139 | Good 47.2% |
Demographics Similar to Ghanaians by Currently Married
In terms of currently married, the demographic groups most similar to Ghanaians are Guatemalan (42.9%, a difference of 0.020%), Immigrants from Middle Africa (43.0%, a difference of 0.13%), Native/Alaskan (42.8%, a difference of 0.29%), Paiute (42.7%, a difference of 0.52%), and Immigrants from El Salvador (43.1%, a difference of 0.53%).
| Demographics | Rating | Rank | Currently Married |
| Central American Indians | 0.0 /100 | #279 | Tragic 43.3% |
| Apache | 0.0 /100 | #280 | Tragic 43.2% |
| Chippewa | 0.0 /100 | #281 | Tragic 43.2% |
| Immigrants | Ecuador | 0.0 /100 | #282 | Tragic 43.2% |
| Kiowa | 0.0 /100 | #283 | Tragic 43.2% |
| Immigrants | El Salvador | 0.0 /100 | #284 | Tragic 43.1% |
| Immigrants | Middle Africa | 0.0 /100 | #285 | Tragic 43.0% |
| Ghanaians | 0.0 /100 | #286 | Tragic 42.9% |
| Guatemalans | 0.0 /100 | #287 | Tragic 42.9% |
| Natives/Alaskans | 0.0 /100 | #288 | Tragic 42.8% |
| Paiute | 0.0 /100 | #289 | Tragic 42.7% |
| Immigrants | Ghana | 0.0 /100 | #290 | Tragic 42.7% |
| Immigrants | Guatemala | 0.0 /100 | #291 | Tragic 42.6% |
| Sub-Saharan Africans | 0.0 /100 | #292 | Tragic 42.6% |
| Yuman | 0.0 /100 | #293 | Tragic 42.6% |