Immigrants from El Salvador vs Arab Currently Married
COMPARE
Immigrants from El Salvador
Arab
Currently Married
Currently Married Comparison
Immigrants from El Salvador
Arabs
43.1%
CURRENTLY MARRIED
0.0/ 100
METRIC RATING
284th/ 347
METRIC RANK
47.0%
CURRENTLY MARRIED
68.6/ 100
METRIC RATING
155th/ 347
METRIC RANK
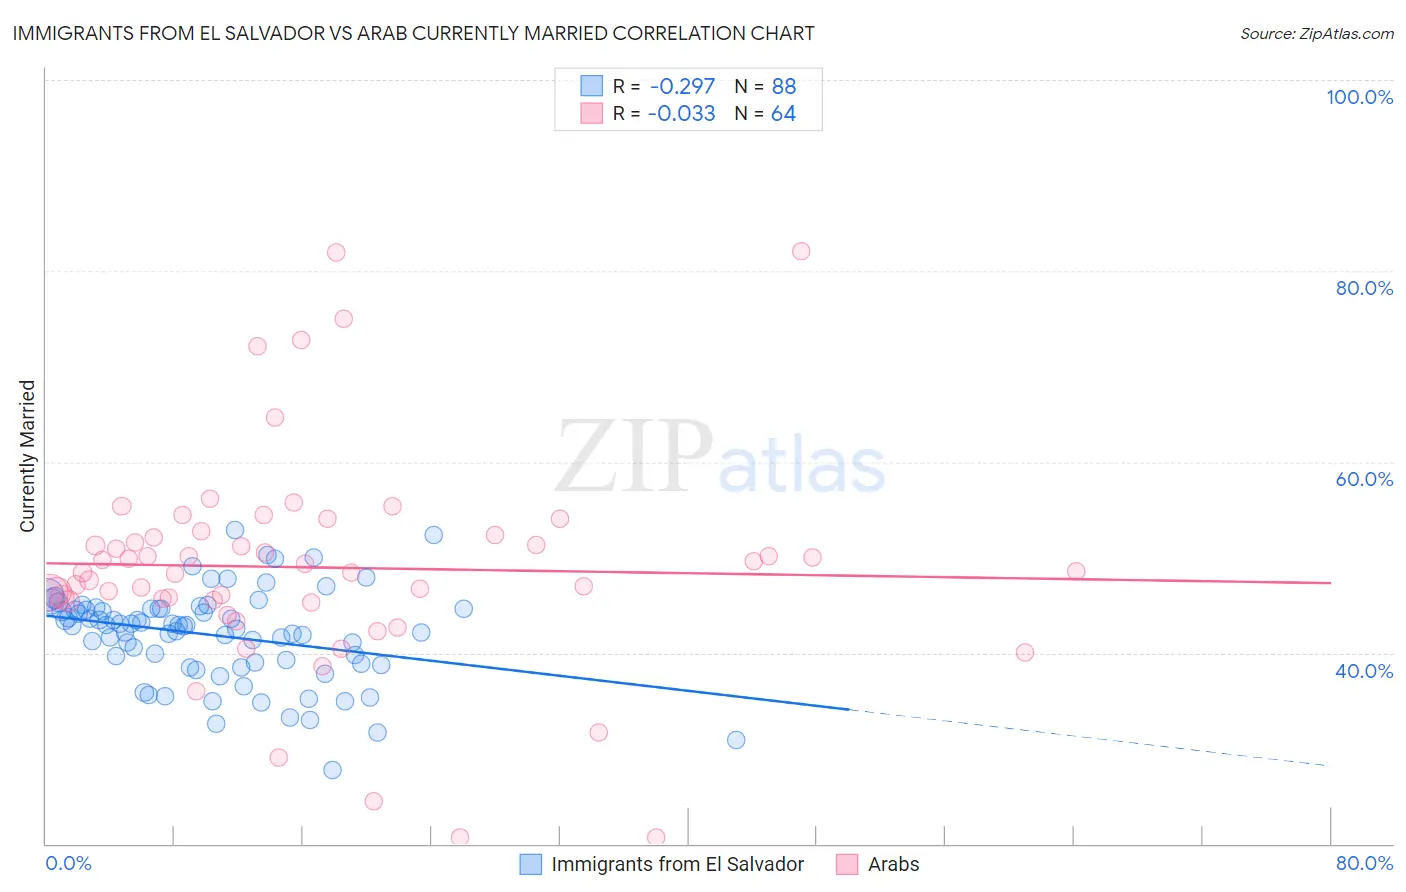
Immigrants from El Salvador vs Arab Currently Married Correlation Chart
The statistical analysis conducted on geographies consisting of 357,815,519 people shows a weak negative correlation between the proportion of Immigrants from El Salvador and percentage of population currently married in the United States with a correlation coefficient (R) of -0.297 and weighted average of 43.1%. Similarly, the statistical analysis conducted on geographies consisting of 486,767,077 people shows no correlation between the proportion of Arabs and percentage of population currently married in the United States with a correlation coefficient (R) of -0.033 and weighted average of 47.0%, a difference of 8.8%.
Currently Married Correlation Summary
| Measurement | Immigrants from El Salvador | Arab |
| Minimum | 27.7% | 20.6% |
| Maximum | 52.9% | 82.1% |
| Range | 25.1% | 61.5% |
| Mean | 41.9% | 48.9% |
| Median | 42.9% | 48.5% |
| Interquartile 25% (IQ1) | 38.9% | 45.4% |
| Interquartile 75% (IQ3) | 44.7% | 52.2% |
| Interquartile Range (IQR) | 5.8% | 6.7% |
| Standard Deviation (Sample) | 4.8% | 11.4% |
| Standard Deviation (Population) | 4.8% | 11.3% |
Similar Demographics by Currently Married
Demographics Similar to Immigrants from El Salvador by Currently Married
In terms of currently married, the demographic groups most similar to Immigrants from El Salvador are Kiowa (43.2%, a difference of 0.010%), Immigrants from Ecuador (43.2%, a difference of 0.12%), Apache (43.2%, a difference of 0.20%), Chippewa (43.2%, a difference of 0.20%), and Central American Indian (43.3%, a difference of 0.28%).
| Demographics | Rating | Rank | Currently Married |
| Immigrants | Nigeria | 0.1 /100 | #277 | Tragic 43.4% |
| Central Americans | 0.0 /100 | #278 | Tragic 43.3% |
| Central American Indians | 0.0 /100 | #279 | Tragic 43.3% |
| Apache | 0.0 /100 | #280 | Tragic 43.2% |
| Chippewa | 0.0 /100 | #281 | Tragic 43.2% |
| Immigrants | Ecuador | 0.0 /100 | #282 | Tragic 43.2% |
| Kiowa | 0.0 /100 | #283 | Tragic 43.2% |
| Immigrants | El Salvador | 0.0 /100 | #284 | Tragic 43.1% |
| Immigrants | Middle Africa | 0.0 /100 | #285 | Tragic 43.0% |
| Ghanaians | 0.0 /100 | #286 | Tragic 42.9% |
| Guatemalans | 0.0 /100 | #287 | Tragic 42.9% |
| Natives/Alaskans | 0.0 /100 | #288 | Tragic 42.8% |
| Paiute | 0.0 /100 | #289 | Tragic 42.7% |
| Immigrants | Ghana | 0.0 /100 | #290 | Tragic 42.7% |
| Immigrants | Guatemala | 0.0 /100 | #291 | Tragic 42.6% |
Demographics Similar to Arabs by Currently Married
In terms of currently married, the demographic groups most similar to Arabs are Immigrants from Venezuela (47.0%, a difference of 0.0%), Albanian (47.0%, a difference of 0.0%), Immigrants from Serbia (47.0%, a difference of 0.010%), Spanish (47.0%, a difference of 0.020%), and Immigrants from Switzerland (46.9%, a difference of 0.030%).
| Demographics | Rating | Rank | Currently Married |
| Cambodians | 70.4 /100 | #148 | Good 47.0% |
| Zimbabweans | 70.1 /100 | #149 | Good 47.0% |
| Immigrants | Turkey | 70.0 /100 | #150 | Good 47.0% |
| Chileans | 69.8 /100 | #151 | Good 47.0% |
| Immigrants | Serbia | 68.8 /100 | #152 | Good 47.0% |
| Immigrants | Venezuela | 68.6 /100 | #153 | Good 47.0% |
| Albanians | 68.6 /100 | #154 | Good 47.0% |
| Arabs | 68.6 /100 | #155 | Good 47.0% |
| Spanish | 68.1 /100 | #156 | Good 47.0% |
| Immigrants | Switzerland | 67.8 /100 | #157 | Good 46.9% |
| Cherokee | 66.8 /100 | #158 | Good 46.9% |
| Iraqis | 66.4 /100 | #159 | Good 46.9% |
| Immigrants | Uzbekistan | 66.0 /100 | #160 | Good 46.9% |
| Immigrants | Southern Europe | 65.9 /100 | #161 | Good 46.9% |
| Immigrants | Nonimmigrants | 65.4 /100 | #162 | Good 46.9% |