Immigrants from West Indies vs Immigrants from Pakistan Average Family Size
COMPARE
Immigrants from West Indies
Immigrants from Pakistan
Average Family Size
Average Family Size Comparison
Immigrants from West Indies
Immigrants from Pakistan
3.33
AVERAGE FAMILY SIZE
99.9/ 100
METRIC RATING
71st/ 347
METRIC RANK
3.30
AVERAGE FAMILY SIZE
99.2/ 100
METRIC RATING
91st/ 347
METRIC RANK
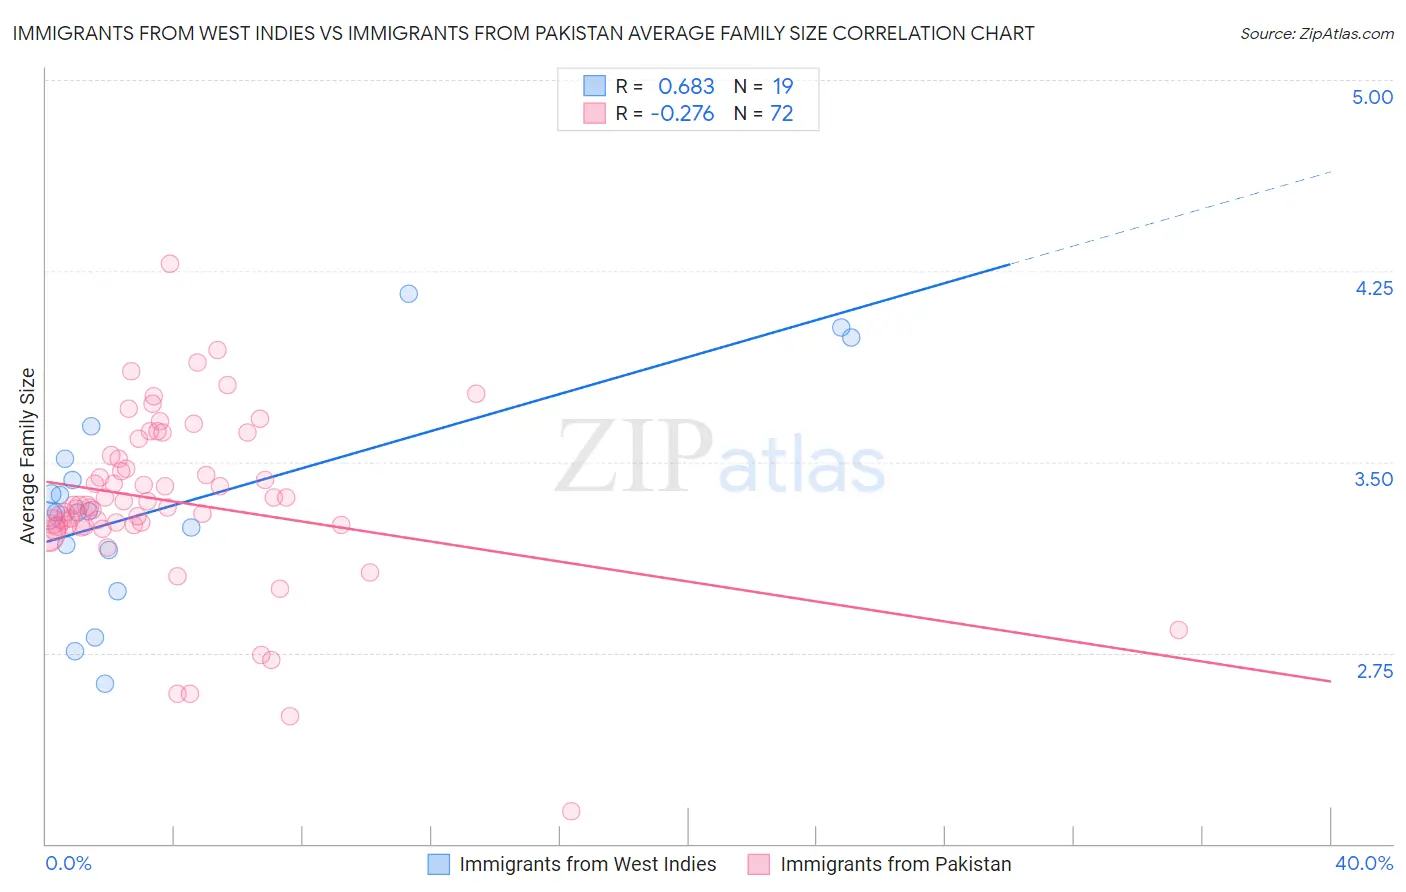
Immigrants from West Indies vs Immigrants from Pakistan Average Family Size Correlation Chart
The statistical analysis conducted on geographies consisting of 72,454,628 people shows a significant positive correlation between the proportion of Immigrants from West Indies and average family size in the United States with a correlation coefficient (R) of 0.683 and weighted average of 3.33. Similarly, the statistical analysis conducted on geographies consisting of 283,802,176 people shows a weak negative correlation between the proportion of Immigrants from Pakistan and average family size in the United States with a correlation coefficient (R) of -0.276 and weighted average of 3.30, a difference of 0.86%.
Average Family Size Correlation Summary
| Measurement | Immigrants from West Indies | Immigrants from Pakistan |
| Minimum | 2.63 | 2.13 |
| Maximum | 4.16 | 4.28 |
| Range | 1.53 | 2.15 |
| Mean | 3.34 | 3.34 |
| Median | 3.30 | 3.33 |
| Interquartile 25% (IQ1) | 3.15 | 3.25 |
| Interquartile 75% (IQ3) | 3.51 | 3.52 |
| Interquartile Range (IQR) | 0.36 | 0.27 |
| Standard Deviation (Sample) | 0.41 | 0.34 |
| Standard Deviation (Population) | 0.40 | 0.34 |
Demographics Similar to Immigrants from West Indies and Immigrants from Pakistan by Average Family Size
In terms of average family size, the demographic groups most similar to Immigrants from West Indies are Immigrants from Caribbean (3.33, a difference of 0.070%), Yaqui (3.32, a difference of 0.10%), Immigrants from Sierra Leone (3.32, a difference of 0.13%), Immigrants from Barbados (3.32, a difference of 0.16%), and Trinidadian and Tobagonian (3.32, a difference of 0.18%). Similarly, the demographic groups most similar to Immigrants from Pakistan are Menominee (3.30, a difference of 0.15%), Malaysian (3.31, a difference of 0.26%), Immigrants from Bolivia (3.31, a difference of 0.27%), Immigrants from Peru (3.31, a difference of 0.36%), and Jamaican (3.31, a difference of 0.41%).
| Demographics | Rating | Rank | Average Family Size |
| Immigrants | West Indies | 99.9 /100 | #71 | Exceptional 3.33 |
| Immigrants | Caribbean | 99.9 /100 | #72 | Exceptional 3.33 |
| Yaqui | 99.9 /100 | #73 | Exceptional 3.32 |
| Immigrants | Sierra Leone | 99.9 /100 | #74 | Exceptional 3.32 |
| Immigrants | Barbados | 99.8 /100 | #75 | Exceptional 3.32 |
| Trinidadians and Tobagonians | 99.8 /100 | #76 | Exceptional 3.32 |
| Immigrants | Ecuador | 99.8 /100 | #77 | Exceptional 3.32 |
| Immigrants | Micronesia | 99.8 /100 | #78 | Exceptional 3.32 |
| British West Indians | 99.8 /100 | #79 | Exceptional 3.32 |
| Lumbee | 99.8 /100 | #80 | Exceptional 3.32 |
| Immigrants | Dominica | 99.8 /100 | #81 | Exceptional 3.32 |
| Ecuadorians | 99.8 /100 | #82 | Exceptional 3.32 |
| Immigrants | Afghanistan | 99.8 /100 | #83 | Exceptional 3.32 |
| Immigrants | Nigeria | 99.7 /100 | #84 | Exceptional 3.32 |
| Afghans | 99.7 /100 | #85 | Exceptional 3.31 |
| Jamaicans | 99.7 /100 | #86 | Exceptional 3.31 |
| Immigrants | Peru | 99.7 /100 | #87 | Exceptional 3.31 |
| Immigrants | Bolivia | 99.6 /100 | #88 | Exceptional 3.31 |
| Malaysians | 99.6 /100 | #89 | Exceptional 3.31 |
| Menominee | 99.4 /100 | #90 | Exceptional 3.30 |
| Immigrants | Pakistan | 99.2 /100 | #91 | Exceptional 3.30 |