Cherokee vs Immigrants from Pakistan Average Family Size
COMPARE
Cherokee
Immigrants from Pakistan
Average Family Size
Average Family Size Comparison
Cherokee
Immigrants from Pakistan
3.18
AVERAGE FAMILY SIZE
4.7/ 100
METRIC RATING
232nd/ 347
METRIC RANK
3.30
AVERAGE FAMILY SIZE
99.2/ 100
METRIC RATING
91st/ 347
METRIC RANK
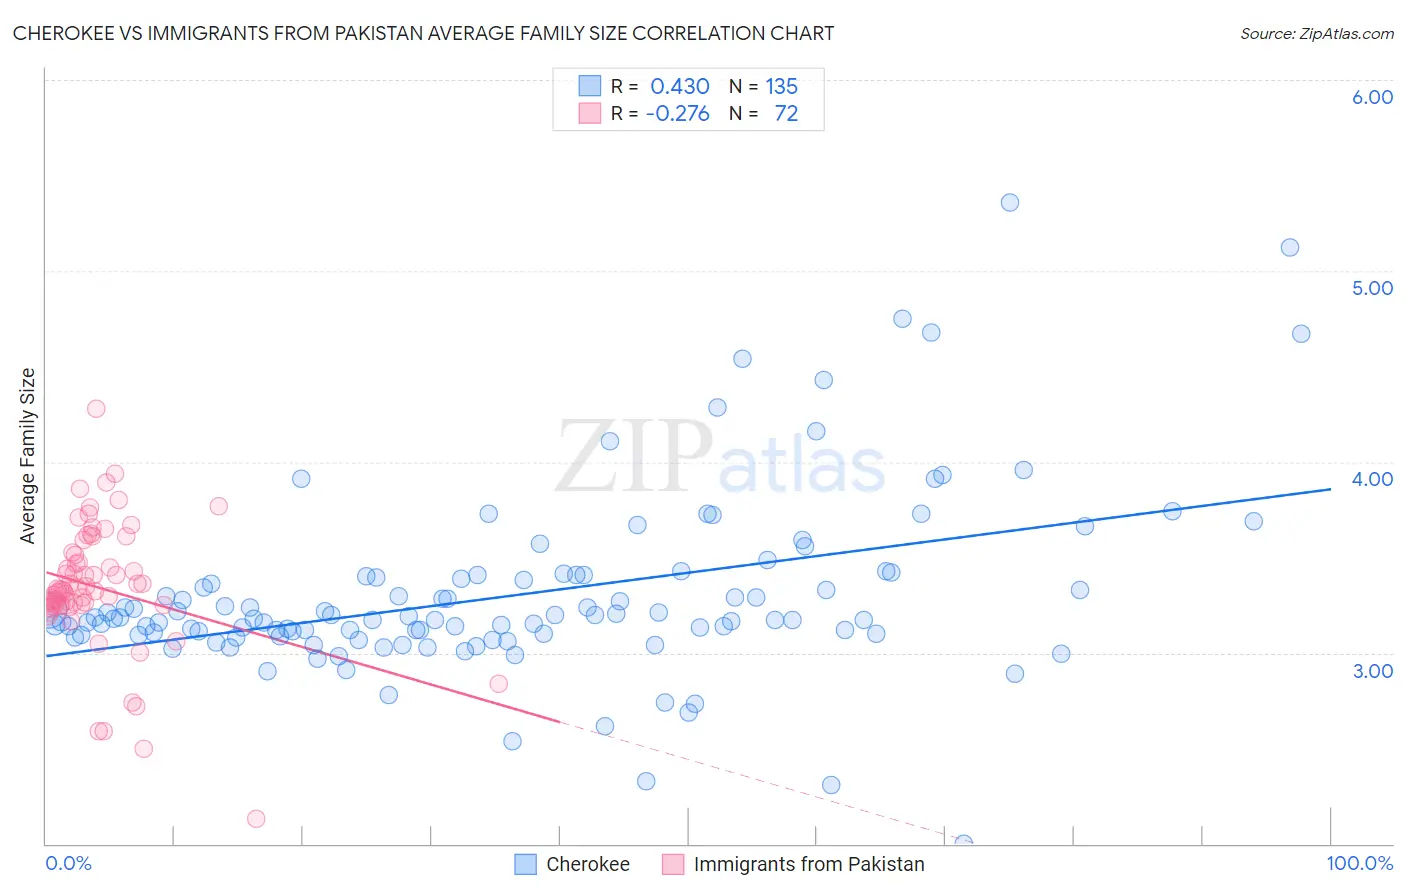
Cherokee vs Immigrants from Pakistan Average Family Size Correlation Chart
The statistical analysis conducted on geographies consisting of 493,383,050 people shows a moderate positive correlation between the proportion of Cherokee and average family size in the United States with a correlation coefficient (R) of 0.430 and weighted average of 3.18. Similarly, the statistical analysis conducted on geographies consisting of 283,802,176 people shows a weak negative correlation between the proportion of Immigrants from Pakistan and average family size in the United States with a correlation coefficient (R) of -0.276 and weighted average of 3.30, a difference of 3.6%.
Average Family Size Correlation Summary
| Measurement | Cherokee | Immigrants from Pakistan |
| Minimum | 2.00 | 2.13 |
| Maximum | 5.36 | 4.28 |
| Range | 3.36 | 2.15 |
| Mean | 3.30 | 3.34 |
| Median | 3.18 | 3.33 |
| Interquartile 25% (IQ1) | 3.09 | 3.25 |
| Interquartile 75% (IQ3) | 3.40 | 3.52 |
| Interquartile Range (IQR) | 0.30 | 0.27 |
| Standard Deviation (Sample) | 0.48 | 0.34 |
| Standard Deviation (Population) | 0.48 | 0.34 |
Similar Demographics by Average Family Size
Demographics Similar to Cherokee by Average Family Size
In terms of average family size, the demographic groups most similar to Cherokee are Brazilian (3.18, a difference of 0.020%), Iranian (3.18, a difference of 0.030%), Icelander (3.19, a difference of 0.040%), Basque (3.19, a difference of 0.040%), and Immigrants from Turkey (3.18, a difference of 0.050%).
| Demographics | Rating | Rank | Average Family Size |
| Cree | 6.2 /100 | #225 | Tragic 3.19 |
| Chickasaw | 6.0 /100 | #226 | Tragic 3.19 |
| Portuguese | 6.0 /100 | #227 | Tragic 3.19 |
| Immigrants | Nonimmigrants | 5.7 /100 | #228 | Tragic 3.19 |
| Immigrants | Italy | 5.3 /100 | #229 | Tragic 3.19 |
| Icelanders | 5.2 /100 | #230 | Tragic 3.19 |
| Basques | 5.2 /100 | #231 | Tragic 3.19 |
| Cherokee | 4.7 /100 | #232 | Tragic 3.18 |
| Brazilians | 4.5 /100 | #233 | Tragic 3.18 |
| Iranians | 4.5 /100 | #234 | Tragic 3.18 |
| Immigrants | Turkey | 4.2 /100 | #235 | Tragic 3.18 |
| Immigrants | Portugal | 4.2 /100 | #236 | Tragic 3.18 |
| Immigrants | Romania | 3.7 /100 | #237 | Tragic 3.18 |
| Romanians | 3.7 /100 | #238 | Tragic 3.18 |
| Houma | 3.4 /100 | #239 | Tragic 3.18 |
Demographics Similar to Immigrants from Pakistan by Average Family Size
In terms of average family size, the demographic groups most similar to Immigrants from Pakistan are Immigrants from Cameroon (3.30, a difference of 0.010%), Peruvian (3.30, a difference of 0.020%), Sierra Leonean (3.30, a difference of 0.12%), Immigrants from Lebanon (3.30, a difference of 0.13%), and Menominee (3.30, a difference of 0.15%).
| Demographics | Rating | Rank | Average Family Size |
| Immigrants | Nigeria | 99.7 /100 | #84 | Exceptional 3.32 |
| Afghans | 99.7 /100 | #85 | Exceptional 3.31 |
| Jamaicans | 99.7 /100 | #86 | Exceptional 3.31 |
| Immigrants | Peru | 99.7 /100 | #87 | Exceptional 3.31 |
| Immigrants | Bolivia | 99.6 /100 | #88 | Exceptional 3.31 |
| Malaysians | 99.6 /100 | #89 | Exceptional 3.31 |
| Menominee | 99.4 /100 | #90 | Exceptional 3.30 |
| Immigrants | Pakistan | 99.2 /100 | #91 | Exceptional 3.30 |
| Immigrants | Cameroon | 99.2 /100 | #92 | Exceptional 3.30 |
| Peruvians | 99.2 /100 | #93 | Exceptional 3.30 |
| Sierra Leoneans | 99.0 /100 | #94 | Exceptional 3.30 |
| Immigrants | Lebanon | 99.0 /100 | #95 | Exceptional 3.30 |
| U.S. Virgin Islanders | 98.8 /100 | #96 | Exceptional 3.29 |
| Immigrants | Oceania | 98.7 /100 | #97 | Exceptional 3.29 |
| Barbadians | 98.6 /100 | #98 | Exceptional 3.29 |