Slovak vs Soviet Union Single Mother Households
COMPARE
Slovak
Soviet Union
Single Mother Households
Single Mother Households Comparison
Slovaks
Soviet Union
5.7%
SINGLE MOTHER HOUSEHOLDS
96.6/ 100
METRIC RATING
95th/ 347
METRIC RANK
5.1%
SINGLE MOTHER HOUSEHOLDS
99.9/ 100
METRIC RATING
17th/ 347
METRIC RANK
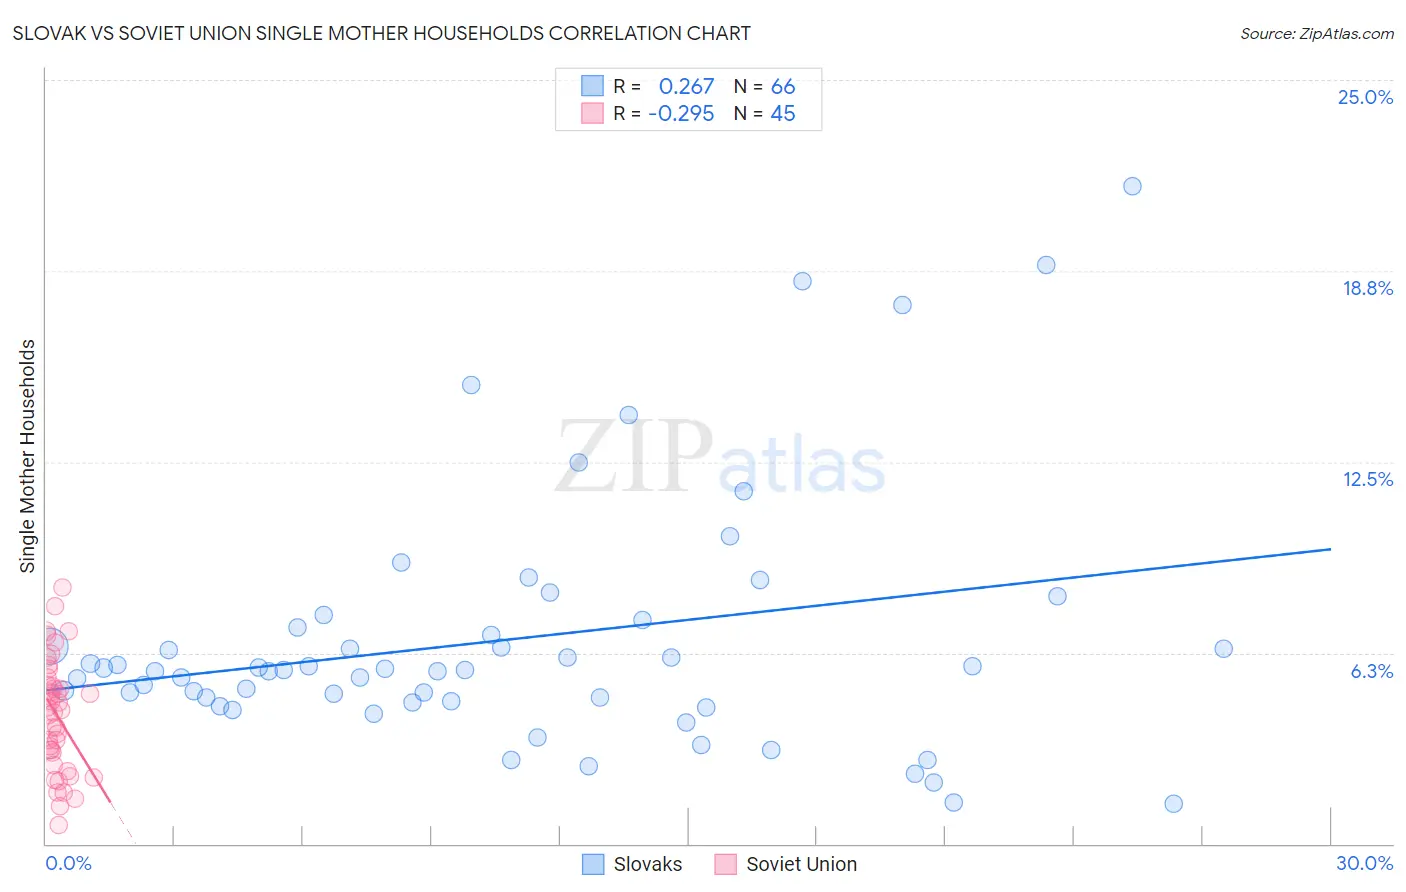
Slovak vs Soviet Union Single Mother Households Correlation Chart
The statistical analysis conducted on geographies consisting of 396,232,122 people shows a weak positive correlation between the proportion of Slovaks and percentage of single mother households in the United States with a correlation coefficient (R) of 0.267 and weighted average of 5.7%. Similarly, the statistical analysis conducted on geographies consisting of 43,424,989 people shows a weak negative correlation between the proportion of Soviet Union and percentage of single mother households in the United States with a correlation coefficient (R) of -0.295 and weighted average of 5.1%, a difference of 12.0%.
Single Mother Households Correlation Summary
| Measurement | Slovak | Soviet Union |
| Minimum | 1.3% | 0.63% |
| Maximum | 21.5% | 8.4% |
| Range | 20.2% | 7.7% |
| Mean | 6.7% | 4.2% |
| Median | 5.7% | 4.4% |
| Interquartile 25% (IQ1) | 4.7% | 2.8% |
| Interquartile 75% (IQ3) | 7.1% | 5.3% |
| Interquartile Range (IQR) | 2.4% | 2.5% |
| Standard Deviation (Sample) | 4.1% | 1.8% |
| Standard Deviation (Population) | 4.1% | 1.8% |
Similar Demographics by Single Mother Households
Demographics Similar to Slovaks by Single Mother Households
In terms of single mother households, the demographic groups most similar to Slovaks are Basque (5.7%, a difference of 0.060%), Serbian (5.7%, a difference of 0.11%), Immigrants from Western Asia (5.7%, a difference of 0.12%), Austrian (5.7%, a difference of 0.15%), and Tlingit-Haida (5.7%, a difference of 0.20%).
| Demographics | Rating | Rank | Single Mother Households |
| Israelis | 97.4 /100 | #88 | Exceptional 5.7% |
| Ukrainians | 97.2 /100 | #89 | Exceptional 5.7% |
| Immigrants | Indonesia | 97.2 /100 | #90 | Exceptional 5.7% |
| Europeans | 97.0 /100 | #91 | Exceptional 5.7% |
| Immigrants | Western Asia | 96.7 /100 | #92 | Exceptional 5.7% |
| Serbians | 96.7 /100 | #93 | Exceptional 5.7% |
| Basques | 96.7 /100 | #94 | Exceptional 5.7% |
| Slovaks | 96.6 /100 | #95 | Exceptional 5.7% |
| Austrians | 96.4 /100 | #96 | Exceptional 5.7% |
| Tlingit-Haida | 96.4 /100 | #97 | Exceptional 5.7% |
| Immigrants | South Africa | 96.3 /100 | #98 | Exceptional 5.7% |
| Immigrants | Poland | 96.3 /100 | #99 | Exceptional 5.8% |
| Scandinavians | 96.2 /100 | #100 | Exceptional 5.8% |
| Germans | 96.2 /100 | #101 | Exceptional 5.8% |
| English | 96.2 /100 | #102 | Exceptional 5.8% |
Demographics Similar to Soviet Union by Single Mother Households
In terms of single mother households, the demographic groups most similar to Soviet Union are Indian (Asian) (5.1%, a difference of 0.21%), Immigrants from Eastern Asia (5.1%, a difference of 0.40%), Immigrants from Australia (5.1%, a difference of 0.49%), Immigrants from Armenia (5.2%, a difference of 0.78%), and Immigrants from India (5.1%, a difference of 0.81%).
| Demographics | Rating | Rank | Single Mother Households |
| Immigrants | Israel | 99.9 /100 | #10 | Exceptional 5.0% |
| Immigrants | China | 99.9 /100 | #11 | Exceptional 5.1% |
| Cypriots | 99.9 /100 | #12 | Exceptional 5.1% |
| Immigrants | India | 99.9 /100 | #13 | Exceptional 5.1% |
| Immigrants | Australia | 99.9 /100 | #14 | Exceptional 5.1% |
| Immigrants | Eastern Asia | 99.9 /100 | #15 | Exceptional 5.1% |
| Indians (Asian) | 99.9 /100 | #16 | Exceptional 5.1% |
| Soviet Union | 99.9 /100 | #17 | Exceptional 5.1% |
| Immigrants | Armenia | 99.9 /100 | #18 | Exceptional 5.2% |
| Chinese | 99.9 /100 | #19 | Exceptional 5.2% |
| Maltese | 99.9 /100 | #20 | Exceptional 5.2% |
| Eastern Europeans | 99.8 /100 | #21 | Exceptional 5.2% |
| Thais | 99.8 /100 | #22 | Exceptional 5.2% |
| Immigrants | Austria | 99.8 /100 | #23 | Exceptional 5.2% |
| Armenians | 99.8 /100 | #24 | Exceptional 5.2% |