Taiwanese vs Barbadian Divorced or Separated
COMPARE
Taiwanese
Barbadian
Divorced or Separated
Divorced or Separated Comparison
Taiwanese
Barbadians
11.5%
DIVORCED OR SEPARATED
99.6/ 100
METRIC RATING
74th/ 347
METRIC RANK
12.1%
DIVORCED OR SEPARATED
45.0/ 100
METRIC RATING
180th/ 347
METRIC RANK
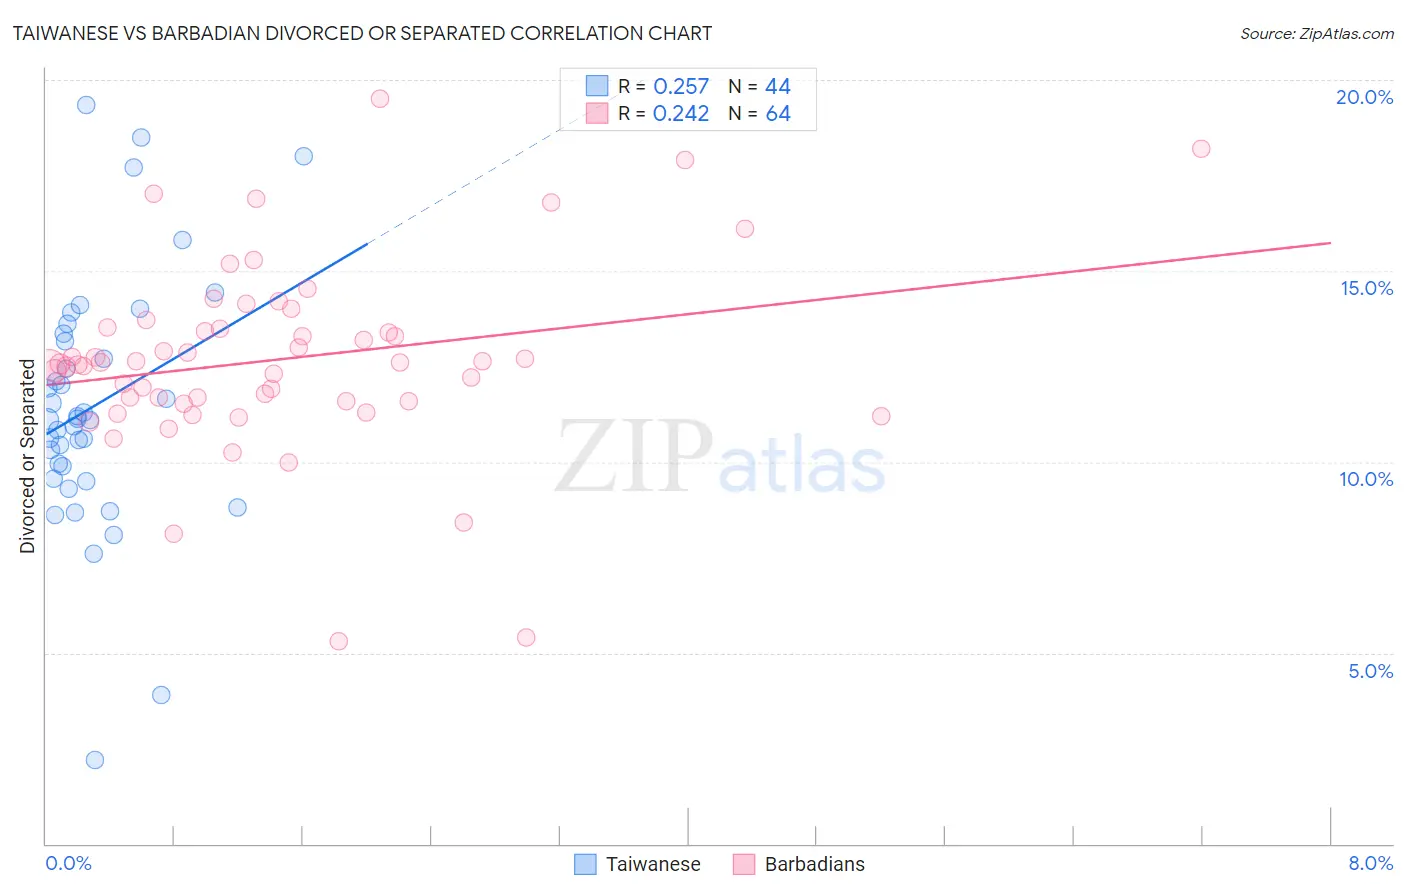
Taiwanese vs Barbadian Divorced or Separated Correlation Chart
The statistical analysis conducted on geographies consisting of 31,709,765 people shows a weak positive correlation between the proportion of Taiwanese and percentage of population currently divorced or separated in the United States with a correlation coefficient (R) of 0.257 and weighted average of 11.5%. Similarly, the statistical analysis conducted on geographies consisting of 141,266,307 people shows a weak positive correlation between the proportion of Barbadians and percentage of population currently divorced or separated in the United States with a correlation coefficient (R) of 0.242 and weighted average of 12.1%, a difference of 5.2%.
Divorced or Separated Correlation Summary
| Measurement | Taiwanese | Barbadian |
| Minimum | 2.2% | 5.3% |
| Maximum | 19.3% | 19.5% |
| Range | 17.1% | 14.2% |
| Mean | 11.5% | 12.7% |
| Median | 11.1% | 12.6% |
| Interquartile 25% (IQ1) | 9.7% | 11.6% |
| Interquartile 75% (IQ3) | 13.3% | 13.5% |
| Interquartile Range (IQR) | 3.5% | 1.9% |
| Standard Deviation (Sample) | 3.3% | 2.5% |
| Standard Deviation (Population) | 3.3% | 2.5% |
Similar Demographics by Divorced or Separated
Demographics Similar to Taiwanese by Divorced or Separated
In terms of divorced or separated, the demographic groups most similar to Taiwanese are Jordanian (11.5%, a difference of 0.060%), Immigrants from North Macedonia (11.5%, a difference of 0.060%), Immigrants from Northern Africa (11.5%, a difference of 0.080%), Albanian (11.5%, a difference of 0.10%), and Paraguayan (11.5%, a difference of 0.13%).
| Demographics | Rating | Rank | Divorced or Separated |
| Immigrants | Syria | 99.7 /100 | #67 | Exceptional 11.4% |
| Palestinians | 99.7 /100 | #68 | Exceptional 11.5% |
| Immigrants | Belgium | 99.7 /100 | #69 | Exceptional 11.5% |
| Immigrants | Eastern Europe | 99.7 /100 | #70 | Exceptional 11.5% |
| Paraguayans | 99.7 /100 | #71 | Exceptional 11.5% |
| Jordanians | 99.6 /100 | #72 | Exceptional 11.5% |
| Immigrants | North Macedonia | 99.6 /100 | #73 | Exceptional 11.5% |
| Taiwanese | 99.6 /100 | #74 | Exceptional 11.5% |
| Immigrants | Northern Africa | 99.6 /100 | #75 | Exceptional 11.5% |
| Albanians | 99.6 /100 | #76 | Exceptional 11.5% |
| Immigrants | Italy | 99.5 /100 | #77 | Exceptional 11.5% |
| Afghans | 99.4 /100 | #78 | Exceptional 11.5% |
| Guyanese | 99.4 /100 | #79 | Exceptional 11.5% |
| Immigrants | Switzerland | 99.4 /100 | #80 | Exceptional 11.5% |
| Russians | 99.4 /100 | #81 | Exceptional 11.5% |
Demographics Similar to Barbadians by Divorced or Separated
In terms of divorced or separated, the demographic groups most similar to Barbadians are Immigrants from Western Europe (12.1%, a difference of 0.020%), Ghanaian (12.1%, a difference of 0.030%), Immigrants from Canada (12.1%, a difference of 0.030%), Immigrants from Ethiopia (12.1%, a difference of 0.070%), and Immigrants from Central America (12.1%, a difference of 0.070%).
| Demographics | Rating | Rank | Divorced or Separated |
| Immigrants | Moldova | 50.4 /100 | #173 | Average 12.1% |
| Hawaiians | 50.0 /100 | #174 | Average 12.1% |
| Immigrants | Sierra Leone | 50.0 /100 | #175 | Average 12.1% |
| Pennsylvania Germans | 48.9 /100 | #176 | Average 12.1% |
| Brazilians | 47.7 /100 | #177 | Average 12.1% |
| Ghanaians | 45.9 /100 | #178 | Average 12.1% |
| Immigrants | Western Europe | 45.6 /100 | #179 | Average 12.1% |
| Barbadians | 45.0 /100 | #180 | Average 12.1% |
| Immigrants | Canada | 44.0 /100 | #181 | Average 12.1% |
| Immigrants | Ethiopia | 43.1 /100 | #182 | Average 12.1% |
| Immigrants | Central America | 42.9 /100 | #183 | Average 12.1% |
| Immigrants | North America | 41.1 /100 | #184 | Average 12.1% |
| Immigrants | Nigeria | 40.5 /100 | #185 | Average 12.1% |
| Immigrants | Chile | 39.0 /100 | #186 | Fair 12.1% |
| Belizeans | 37.7 /100 | #187 | Fair 12.1% |