Immigrants from Uzbekistan vs Barbadian Divorced or Separated
COMPARE
Immigrants from Uzbekistan
Barbadian
Divorced or Separated
Divorced or Separated Comparison
Immigrants from Uzbekistan
Barbadians
11.1%
DIVORCED OR SEPARATED
100.0/ 100
METRIC RATING
34th/ 347
METRIC RANK
12.1%
DIVORCED OR SEPARATED
45.0/ 100
METRIC RATING
180th/ 347
METRIC RANK
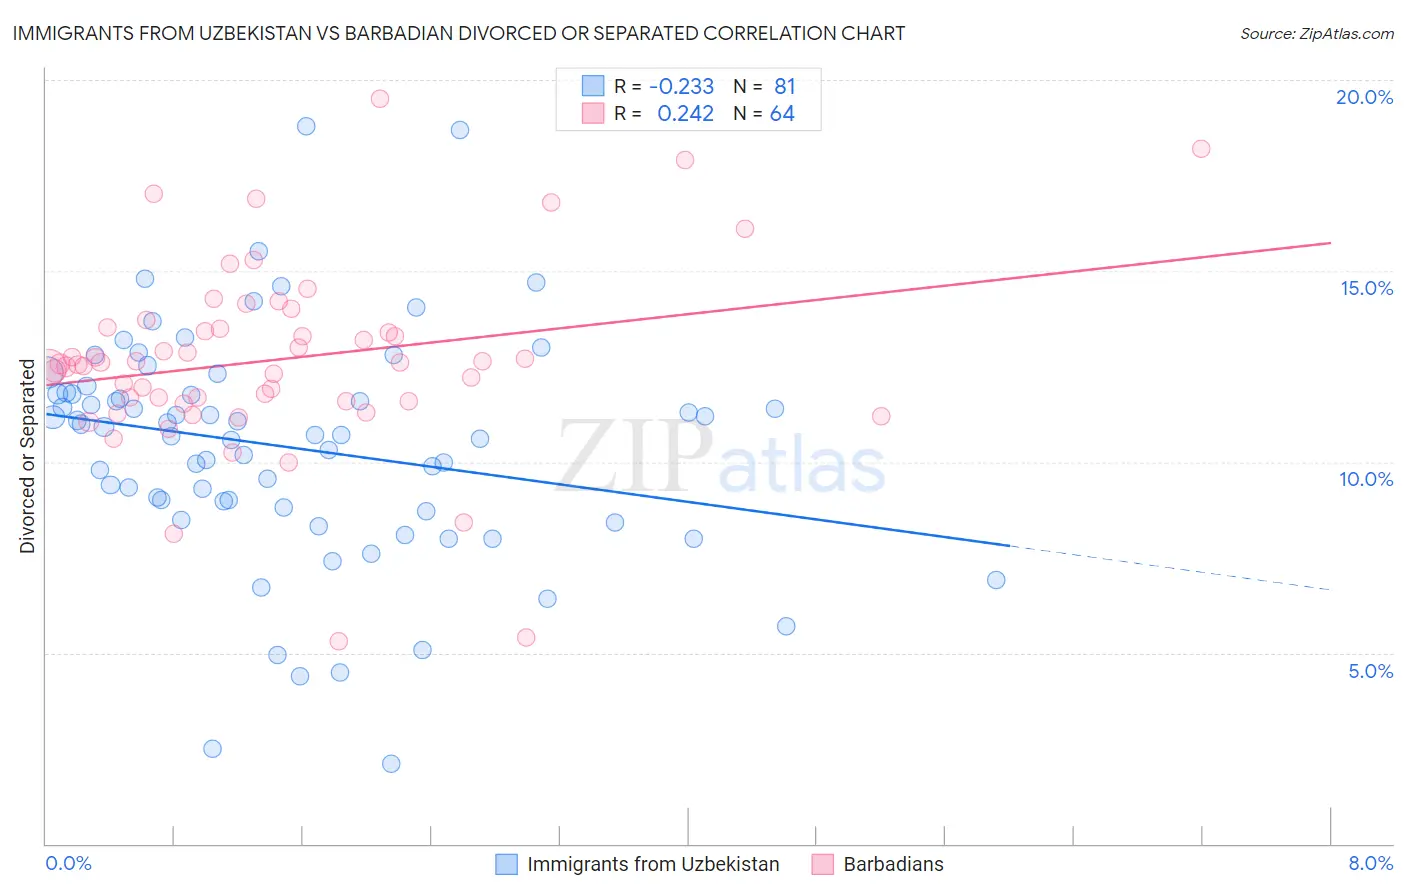
Immigrants from Uzbekistan vs Barbadian Divorced or Separated Correlation Chart
The statistical analysis conducted on geographies consisting of 118,737,303 people shows a weak negative correlation between the proportion of Immigrants from Uzbekistan and percentage of population currently divorced or separated in the United States with a correlation coefficient (R) of -0.233 and weighted average of 11.1%. Similarly, the statistical analysis conducted on geographies consisting of 141,266,307 people shows a weak positive correlation between the proportion of Barbadians and percentage of population currently divorced or separated in the United States with a correlation coefficient (R) of 0.242 and weighted average of 12.1%, a difference of 8.9%.
Divorced or Separated Correlation Summary
| Measurement | Immigrants from Uzbekistan | Barbadian |
| Minimum | 2.1% | 5.3% |
| Maximum | 18.8% | 19.5% |
| Range | 16.7% | 14.2% |
| Mean | 10.4% | 12.7% |
| Median | 10.7% | 12.6% |
| Interquartile 25% (IQ1) | 8.7% | 11.6% |
| Interquartile 75% (IQ3) | 11.8% | 13.5% |
| Interquartile Range (IQR) | 3.1% | 1.9% |
| Standard Deviation (Sample) | 3.0% | 2.5% |
| Standard Deviation (Population) | 3.0% | 2.5% |
Similar Demographics by Divorced or Separated
Demographics Similar to Immigrants from Uzbekistan by Divorced or Separated
In terms of divorced or separated, the demographic groups most similar to Immigrants from Uzbekistan are Egyptian (11.1%, a difference of 0.070%), Cambodian (11.1%, a difference of 0.080%), Tongan (11.1%, a difference of 0.12%), Immigrants from Japan (11.1%, a difference of 0.14%), and Immigrants from Lebanon (11.1%, a difference of 0.15%).
| Demographics | Rating | Rank | Divorced or Separated |
| Immigrants | Bangladesh | 100.0 /100 | #27 | Exceptional 11.0% |
| Immigrants | Malaysia | 100.0 /100 | #28 | Exceptional 11.0% |
| Armenians | 100.0 /100 | #29 | Exceptional 11.0% |
| Immigrants | Ireland | 100.0 /100 | #30 | Exceptional 11.0% |
| Mongolians | 100.0 /100 | #31 | Exceptional 11.1% |
| Tongans | 100.0 /100 | #32 | Exceptional 11.1% |
| Egyptians | 100.0 /100 | #33 | Exceptional 11.1% |
| Immigrants | Uzbekistan | 100.0 /100 | #34 | Exceptional 11.1% |
| Cambodians | 100.0 /100 | #35 | Exceptional 11.1% |
| Immigrants | Japan | 100.0 /100 | #36 | Exceptional 11.1% |
| Immigrants | Lebanon | 100.0 /100 | #37 | Exceptional 11.1% |
| Immigrants | Greece | 100.0 /100 | #38 | Exceptional 11.1% |
| Immigrants | Egypt | 100.0 /100 | #39 | Exceptional 11.1% |
| Soviet Union | 100.0 /100 | #40 | Exceptional 11.1% |
| Bhutanese | 100.0 /100 | #41 | Exceptional 11.2% |
Demographics Similar to Barbadians by Divorced or Separated
In terms of divorced or separated, the demographic groups most similar to Barbadians are Immigrants from Western Europe (12.1%, a difference of 0.020%), Ghanaian (12.1%, a difference of 0.030%), Immigrants from Canada (12.1%, a difference of 0.030%), Immigrants from Ethiopia (12.1%, a difference of 0.070%), and Immigrants from Central America (12.1%, a difference of 0.070%).
| Demographics | Rating | Rank | Divorced or Separated |
| Immigrants | Moldova | 50.4 /100 | #173 | Average 12.1% |
| Hawaiians | 50.0 /100 | #174 | Average 12.1% |
| Immigrants | Sierra Leone | 50.0 /100 | #175 | Average 12.1% |
| Pennsylvania Germans | 48.9 /100 | #176 | Average 12.1% |
| Brazilians | 47.7 /100 | #177 | Average 12.1% |
| Ghanaians | 45.9 /100 | #178 | Average 12.1% |
| Immigrants | Western Europe | 45.6 /100 | #179 | Average 12.1% |
| Barbadians | 45.0 /100 | #180 | Average 12.1% |
| Immigrants | Canada | 44.0 /100 | #181 | Average 12.1% |
| Immigrants | Ethiopia | 43.1 /100 | #182 | Average 12.1% |
| Immigrants | Central America | 42.9 /100 | #183 | Average 12.1% |
| Immigrants | North America | 41.1 /100 | #184 | Average 12.1% |
| Immigrants | Nigeria | 40.5 /100 | #185 | Average 12.1% |
| Immigrants | Chile | 39.0 /100 | #186 | Fair 12.1% |
| Belizeans | 37.7 /100 | #187 | Fair 12.1% |