Tlingit-Haida vs Yakama Single Mother Households
COMPARE
Tlingit-Haida
Yakama
Single Mother Households
Single Mother Households Comparison
Tlingit-Haida
Yakama
5.7%
SINGLE MOTHER HOUSEHOLDS
96.4/ 100
METRIC RATING
97th/ 347
METRIC RANK
8.4%
SINGLE MOTHER HOUSEHOLDS
0.0/ 100
METRIC RATING
328th/ 347
METRIC RANK
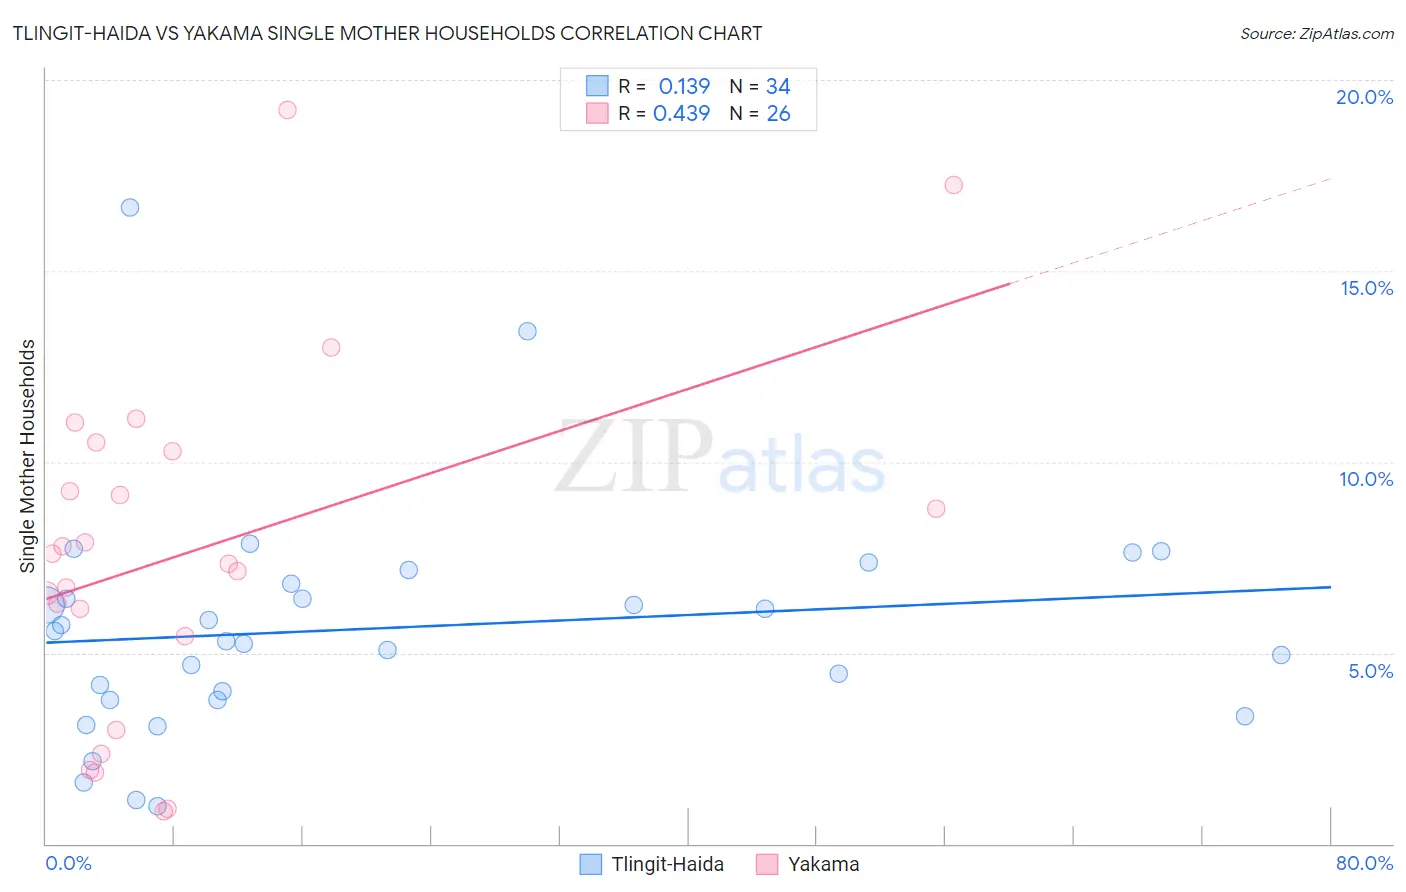
Tlingit-Haida vs Yakama Single Mother Households Correlation Chart
The statistical analysis conducted on geographies consisting of 60,822,631 people shows a poor positive correlation between the proportion of Tlingit-Haida and percentage of single mother households in the United States with a correlation coefficient (R) of 0.139 and weighted average of 5.7%. Similarly, the statistical analysis conducted on geographies consisting of 19,909,884 people shows a moderate positive correlation between the proportion of Yakama and percentage of single mother households in the United States with a correlation coefficient (R) of 0.439 and weighted average of 8.4%, a difference of 46.4%.
Single Mother Households Correlation Summary
| Measurement | Tlingit-Haida | Yakama |
| Minimum | 0.98% | 0.86% |
| Maximum | 16.7% | 19.2% |
| Range | 15.7% | 18.4% |
| Mean | 5.6% | 7.7% |
| Median | 5.4% | 7.5% |
| Interquartile 25% (IQ1) | 3.8% | 5.4% |
| Interquartile 75% (IQ3) | 6.8% | 10.3% |
| Interquartile Range (IQR) | 3.0% | 4.8% |
| Standard Deviation (Sample) | 3.1% | 4.6% |
| Standard Deviation (Population) | 3.0% | 4.5% |
Similar Demographics by Single Mother Households
Demographics Similar to Tlingit-Haida by Single Mother Households
In terms of single mother households, the demographic groups most similar to Tlingit-Haida are Immigrants from South Africa (5.7%, a difference of 0.040%), Austrian (5.7%, a difference of 0.050%), Immigrants from Poland (5.8%, a difference of 0.10%), Scandinavian (5.8%, a difference of 0.11%), and German (5.8%, a difference of 0.14%).
| Demographics | Rating | Rank | Single Mother Households |
| Immigrants | Indonesia | 97.2 /100 | #90 | Exceptional 5.7% |
| Europeans | 97.0 /100 | #91 | Exceptional 5.7% |
| Immigrants | Western Asia | 96.7 /100 | #92 | Exceptional 5.7% |
| Serbians | 96.7 /100 | #93 | Exceptional 5.7% |
| Basques | 96.7 /100 | #94 | Exceptional 5.7% |
| Slovaks | 96.6 /100 | #95 | Exceptional 5.7% |
| Austrians | 96.4 /100 | #96 | Exceptional 5.7% |
| Tlingit-Haida | 96.4 /100 | #97 | Exceptional 5.7% |
| Immigrants | South Africa | 96.3 /100 | #98 | Exceptional 5.7% |
| Immigrants | Poland | 96.3 /100 | #99 | Exceptional 5.8% |
| Scandinavians | 96.2 /100 | #100 | Exceptional 5.8% |
| Germans | 96.2 /100 | #101 | Exceptional 5.8% |
| English | 96.2 /100 | #102 | Exceptional 5.8% |
| Scottish | 96.2 /100 | #103 | Exceptional 5.8% |
| Northern Europeans | 96.2 /100 | #104 | Exceptional 5.8% |
Demographics Similar to Yakama by Single Mother Households
In terms of single mother households, the demographic groups most similar to Yakama are Immigrants from Haiti (8.4%, a difference of 0.18%), British West Indian (8.4%, a difference of 0.32%), Immigrants from Caribbean (8.4%, a difference of 0.45%), Immigrants from Jamaica (8.4%, a difference of 0.63%), and Hopi (8.5%, a difference of 0.75%).
| Demographics | Rating | Rank | Single Mother Households |
| Immigrants | Senegal | 0.0 /100 | #321 | Tragic 8.3% |
| Pima | 0.0 /100 | #322 | Tragic 8.3% |
| Haitians | 0.0 /100 | #323 | Tragic 8.3% |
| Immigrants | Jamaica | 0.0 /100 | #324 | Tragic 8.4% |
| Immigrants | Caribbean | 0.0 /100 | #325 | Tragic 8.4% |
| British West Indians | 0.0 /100 | #326 | Tragic 8.4% |
| Immigrants | Haiti | 0.0 /100 | #327 | Tragic 8.4% |
| Yakama | 0.0 /100 | #328 | Tragic 8.4% |
| Hopi | 0.0 /100 | #329 | Tragic 8.5% |
| Inupiat | 0.0 /100 | #330 | Tragic 8.5% |
| Sioux | 0.0 /100 | #331 | Tragic 8.5% |
| U.S. Virgin Islanders | 0.0 /100 | #332 | Tragic 8.6% |
| Liberians | 0.0 /100 | #333 | Tragic 8.6% |
| Immigrants | Liberia | 0.0 /100 | #334 | Tragic 8.7% |
| Immigrants | Dominica | 0.0 /100 | #335 | Tragic 8.7% |