Ottawa vs Vietnamese Single Mother Households
COMPARE
Ottawa
Vietnamese
Single Mother Households
Single Mother Households Comparison
Ottawa
Vietnamese
6.5%
SINGLE MOTHER HOUSEHOLDS
23.8/ 100
METRIC RATING
188th/ 347
METRIC RANK
6.7%
SINGLE MOTHER HOUSEHOLDS
11.3/ 100
METRIC RATING
208th/ 347
METRIC RANK
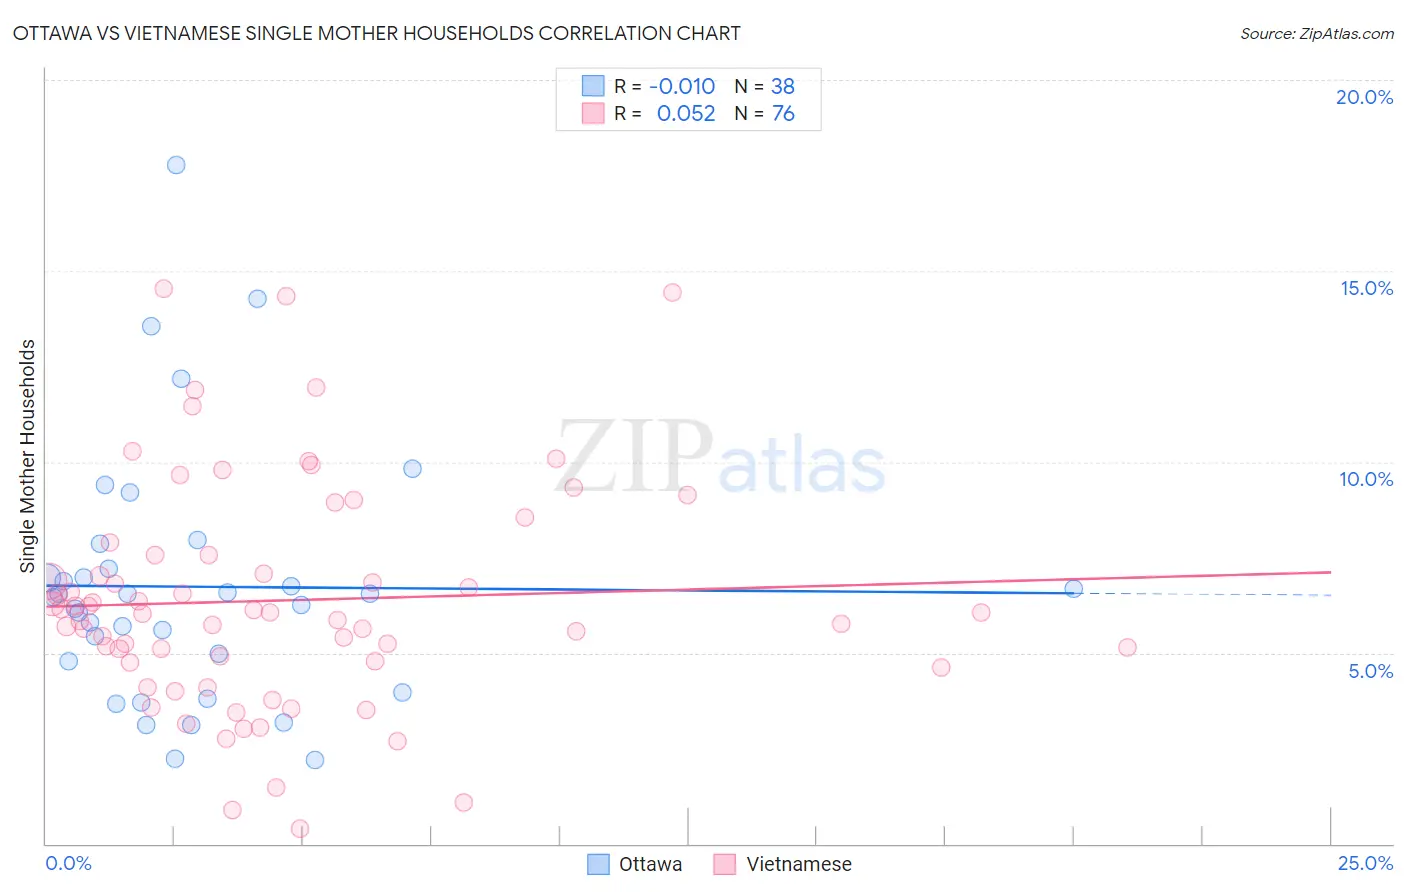
Ottawa vs Vietnamese Single Mother Households Correlation Chart
The statistical analysis conducted on geographies consisting of 49,919,182 people shows no correlation between the proportion of Ottawa and percentage of single mother households in the United States with a correlation coefficient (R) of -0.010 and weighted average of 6.5%. Similarly, the statistical analysis conducted on geographies consisting of 170,499,454 people shows a slight positive correlation between the proportion of Vietnamese and percentage of single mother households in the United States with a correlation coefficient (R) of 0.052 and weighted average of 6.7%, a difference of 2.4%.
Single Mother Households Correlation Summary
| Measurement | Ottawa | Vietnamese |
| Minimum | 2.2% | 0.40% |
| Maximum | 17.8% | 14.5% |
| Range | 15.6% | 14.1% |
| Mean | 6.7% | 6.4% |
| Median | 6.5% | 6.0% |
| Interquartile 25% (IQ1) | 4.8% | 4.8% |
| Interquartile 75% (IQ3) | 7.2% | 7.6% |
| Interquartile Range (IQR) | 2.4% | 2.8% |
| Standard Deviation (Sample) | 3.3% | 3.0% |
| Standard Deviation (Population) | 3.3% | 2.9% |
Demographics Similar to Ottawa and Vietnamese by Single Mother Households
In terms of single mother households, the demographic groups most similar to Ottawa are Delaware (6.5%, a difference of 0.070%), Peruvian (6.5%, a difference of 0.33%), Samoan (6.5%, a difference of 0.39%), American (6.6%, a difference of 0.76%), and Colombian (6.6%, a difference of 0.88%). Similarly, the demographic groups most similar to Vietnamese are German Russian (6.7%, a difference of 0.050%), Immigrants from South America (6.7%, a difference of 0.050%), Cree (6.7%, a difference of 0.14%), Immigrants from Fiji (6.7%, a difference of 0.15%), and Immigrants from Peru (6.7%, a difference of 0.17%).
| Demographics | Rating | Rank | Single Mother Households |
| Ottawa | 23.8 /100 | #188 | Fair 6.5% |
| Delaware | 23.3 /100 | #189 | Fair 6.5% |
| Peruvians | 21.6 /100 | #190 | Fair 6.5% |
| Samoans | 21.2 /100 | #191 | Fair 6.5% |
| Americans | 19.0 /100 | #192 | Poor 6.6% |
| Colombians | 18.3 /100 | #193 | Poor 6.6% |
| Immigrants | Uganda | 18.3 /100 | #194 | Poor 6.6% |
| South Americans | 18.0 /100 | #195 | Poor 6.6% |
| Uruguayans | 18.0 /100 | #196 | Poor 6.6% |
| Moroccans | 17.4 /100 | #197 | Poor 6.6% |
| Hawaiians | 16.1 /100 | #198 | Poor 6.6% |
| Potawatomi | 15.5 /100 | #199 | Poor 6.6% |
| Immigrants | Ethiopia | 14.7 /100 | #200 | Poor 6.6% |
| Venezuelans | 12.9 /100 | #201 | Poor 6.6% |
| Guamanians/Chamorros | 12.4 /100 | #202 | Poor 6.6% |
| Immigrants | Peru | 12.0 /100 | #203 | Poor 6.7% |
| Immigrants | Fiji | 11.9 /100 | #204 | Poor 6.7% |
| Cree | 11.9 /100 | #205 | Poor 6.7% |
| German Russians | 11.5 /100 | #206 | Poor 6.7% |
| Immigrants | South America | 11.5 /100 | #207 | Poor 6.7% |
| Vietnamese | 11.3 /100 | #208 | Poor 6.7% |