Slavic vs Fijian Births to Unmarried Women
COMPARE
Slavic
Fijian
Births to Unmarried Women
Births to Unmarried Women Comparison
Slavs
Fijians
31.6%
BIRTHS TO UNMARRIED WOMEN
52.0/ 100
METRIC RATING
169th/ 347
METRIC RANK
32.3%
BIRTHS TO UNMARRIED WOMEN
31.1/ 100
METRIC RATING
193rd/ 347
METRIC RANK
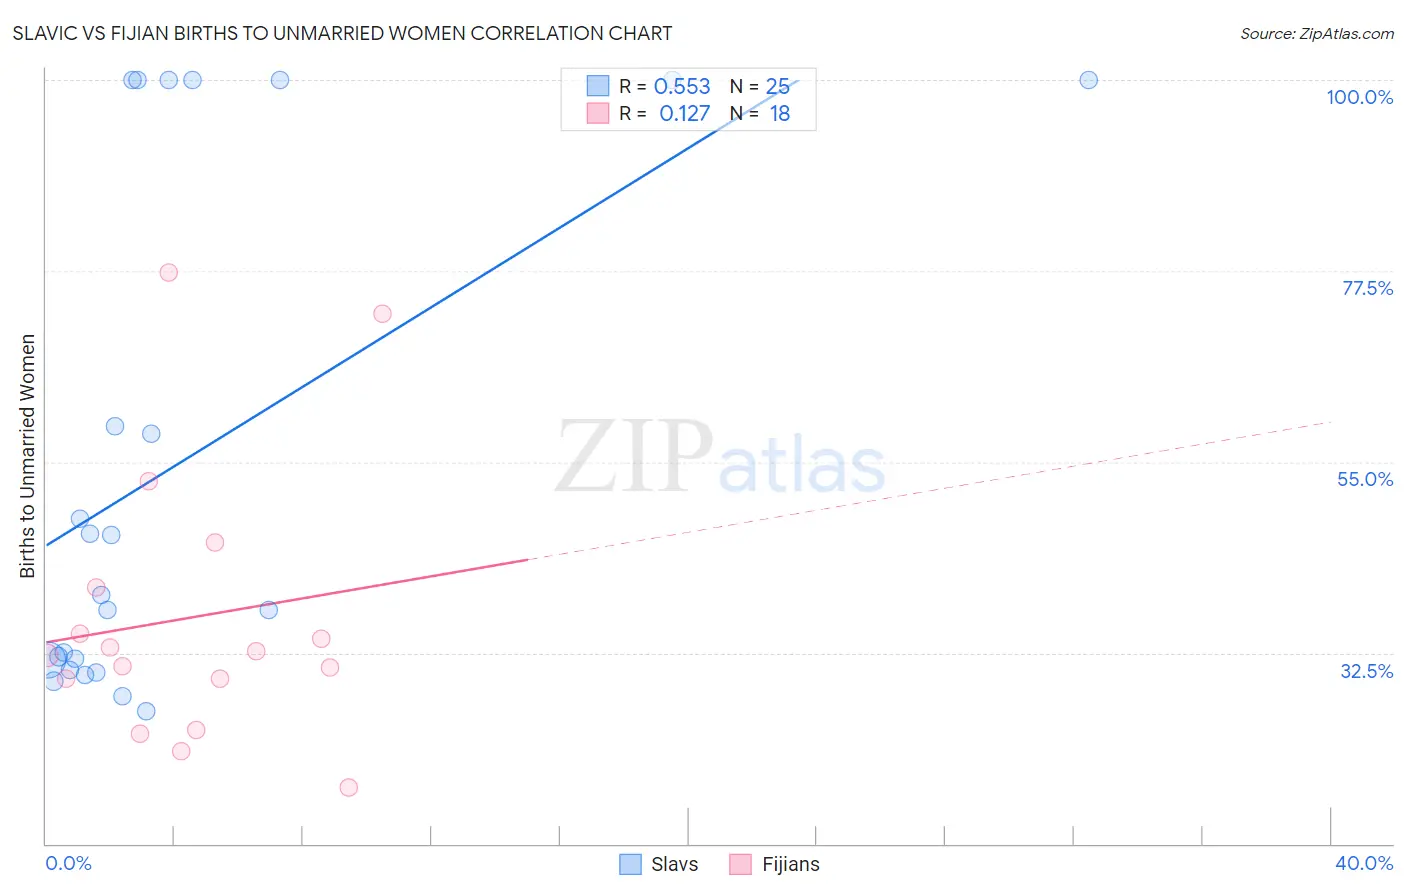
Slavic vs Fijian Births to Unmarried Women Correlation Chart
The statistical analysis conducted on geographies consisting of 254,358,438 people shows a substantial positive correlation between the proportion of Slavs and percentage of births to unmarried women in the United States with a correlation coefficient (R) of 0.553 and weighted average of 31.6%. Similarly, the statistical analysis conducted on geographies consisting of 54,941,736 people shows a poor positive correlation between the proportion of Fijians and percentage of births to unmarried women in the United States with a correlation coefficient (R) of 0.127 and weighted average of 32.3%, a difference of 2.1%.
Births to Unmarried Women Correlation Summary
| Measurement | Slavic | Fijian |
| Minimum | 25.6% | 16.7% |
| Maximum | 100.0% | 77.3% |
| Range | 74.4% | 60.6% |
| Mean | 54.9% | 36.6% |
| Median | 39.3% | 32.4% |
| Interquartile 25% (IQ1) | 31.1% | 29.4% |
| Interquartile 75% (IQ3) | 100.0% | 40.3% |
| Interquartile Range (IQR) | 68.9% | 10.9% |
| Standard Deviation (Sample) | 29.9% | 16.3% |
| Standard Deviation (Population) | 29.3% | 15.8% |
Similar Demographics by Births to Unmarried Women
Demographics Similar to Slavs by Births to Unmarried Women
In terms of births to unmarried women, the demographic groups most similar to Slavs are Belgian (31.6%, a difference of 0.030%), Guamanian/Chamorro (31.6%, a difference of 0.070%), Finnish (31.7%, a difference of 0.14%), Immigrants from Eritrea (31.7%, a difference of 0.15%), and Immigrants from Yemen (31.7%, a difference of 0.17%).
| Demographics | Rating | Rank | Births to Unmarried Women |
| Slovenes | 65.9 /100 | #162 | Good 31.2% |
| Immigrants | Chile | 65.7 /100 | #163 | Good 31.2% |
| Hungarians | 64.1 /100 | #164 | Good 31.2% |
| Immigrants | Somalia | 58.1 /100 | #165 | Average 31.4% |
| Peruvians | 55.5 /100 | #166 | Average 31.5% |
| Dutch | 55.3 /100 | #167 | Average 31.5% |
| Belgians | 52.4 /100 | #168 | Average 31.6% |
| Slavs | 52.0 /100 | #169 | Average 31.6% |
| Guamanians/Chamorros | 51.3 /100 | #170 | Average 31.6% |
| Finns | 50.5 /100 | #171 | Average 31.7% |
| Immigrants | Eritrea | 50.4 /100 | #172 | Average 31.7% |
| Immigrants | Yemen | 50.2 /100 | #173 | Average 31.7% |
| Venezuelans | 50.0 /100 | #174 | Average 31.7% |
| Immigrants | Venezuela | 49.2 /100 | #175 | Average 31.7% |
| Scottish | 48.1 /100 | #176 | Average 31.7% |
Demographics Similar to Fijians by Births to Unmarried Women
In terms of births to unmarried women, the demographic groups most similar to Fijians are Colombian (32.2%, a difference of 0.090%), Irish (32.2%, a difference of 0.14%), Tlingit-Haida (32.2%, a difference of 0.17%), Sudanese (32.4%, a difference of 0.42%), and Immigrants from Kenya (32.1%, a difference of 0.61%).
| Demographics | Rating | Rank | Births to Unmarried Women |
| Welsh | 38.2 /100 | #186 | Fair 32.0% |
| Czechoslovakians | 38.0 /100 | #187 | Fair 32.0% |
| Osage | 37.1 /100 | #188 | Fair 32.1% |
| Immigrants | Kenya | 36.9 /100 | #189 | Fair 32.1% |
| Tlingit-Haida | 32.6 /100 | #190 | Fair 32.2% |
| Irish | 32.4 /100 | #191 | Fair 32.2% |
| Colombians | 31.9 /100 | #192 | Fair 32.2% |
| Fijians | 31.1 /100 | #193 | Fair 32.3% |
| Sudanese | 27.3 /100 | #194 | Fair 32.4% |
| Samoans | 21.9 /100 | #195 | Fair 32.6% |
| Immigrants | Colombia | 21.7 /100 | #196 | Fair 32.6% |
| Immigrants | Immigrants | 20.6 /100 | #197 | Fair 32.7% |
| Costa Ricans | 20.3 /100 | #198 | Fair 32.7% |
| Immigrants | Thailand | 18.9 /100 | #199 | Poor 32.8% |
| Immigrants | Germany | 18.8 /100 | #200 | Poor 32.8% |