Slavic vs Immigrants from Latvia Births to Unmarried Women
COMPARE
Slavic
Immigrants from Latvia
Births to Unmarried Women
Births to Unmarried Women Comparison
Slavs
Immigrants from Latvia
31.6%
BIRTHS TO UNMARRIED WOMEN
52.0/ 100
METRIC RATING
169th/ 347
METRIC RANK
29.1%
BIRTHS TO UNMARRIED WOMEN
96.8/ 100
METRIC RATING
90th/ 347
METRIC RANK
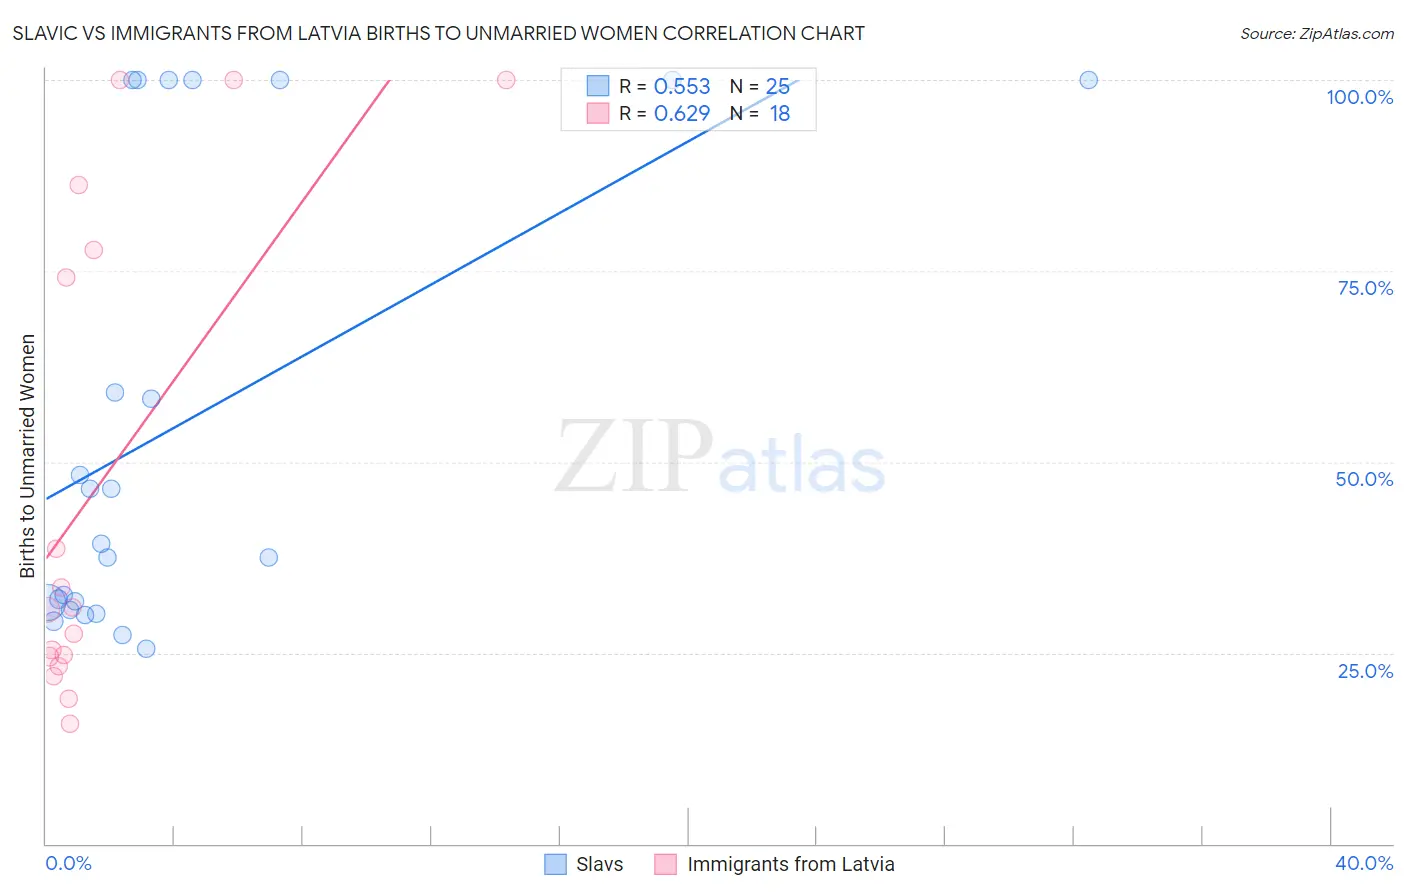
Slavic vs Immigrants from Latvia Births to Unmarried Women Correlation Chart
The statistical analysis conducted on geographies consisting of 254,358,438 people shows a substantial positive correlation between the proportion of Slavs and percentage of births to unmarried women in the United States with a correlation coefficient (R) of 0.553 and weighted average of 31.6%. Similarly, the statistical analysis conducted on geographies consisting of 109,179,125 people shows a significant positive correlation between the proportion of Immigrants from Latvia and percentage of births to unmarried women in the United States with a correlation coefficient (R) of 0.629 and weighted average of 29.1%, a difference of 8.6%.
Births to Unmarried Women Correlation Summary
| Measurement | Slavic | Immigrants from Latvia |
| Minimum | 25.6% | 15.8% |
| Maximum | 100.0% | 100.0% |
| Range | 74.4% | 84.2% |
| Mean | 54.9% | 47.4% |
| Median | 39.3% | 30.8% |
| Interquartile 25% (IQ1) | 31.1% | 24.5% |
| Interquartile 75% (IQ3) | 100.0% | 77.8% |
| Interquartile Range (IQR) | 68.9% | 53.3% |
| Standard Deviation (Sample) | 29.9% | 31.8% |
| Standard Deviation (Population) | 29.3% | 30.9% |
Similar Demographics by Births to Unmarried Women
Demographics Similar to Slavs by Births to Unmarried Women
In terms of births to unmarried women, the demographic groups most similar to Slavs are Belgian (31.6%, a difference of 0.030%), Guamanian/Chamorro (31.6%, a difference of 0.070%), Finnish (31.7%, a difference of 0.14%), Immigrants from Eritrea (31.7%, a difference of 0.15%), and Immigrants from Yemen (31.7%, a difference of 0.17%).
| Demographics | Rating | Rank | Births to Unmarried Women |
| Slovenes | 65.9 /100 | #162 | Good 31.2% |
| Immigrants | Chile | 65.7 /100 | #163 | Good 31.2% |
| Hungarians | 64.1 /100 | #164 | Good 31.2% |
| Immigrants | Somalia | 58.1 /100 | #165 | Average 31.4% |
| Peruvians | 55.5 /100 | #166 | Average 31.5% |
| Dutch | 55.3 /100 | #167 | Average 31.5% |
| Belgians | 52.4 /100 | #168 | Average 31.6% |
| Slavs | 52.0 /100 | #169 | Average 31.6% |
| Guamanians/Chamorros | 51.3 /100 | #170 | Average 31.6% |
| Finns | 50.5 /100 | #171 | Average 31.7% |
| Immigrants | Eritrea | 50.4 /100 | #172 | Average 31.7% |
| Immigrants | Yemen | 50.2 /100 | #173 | Average 31.7% |
| Venezuelans | 50.0 /100 | #174 | Average 31.7% |
| Immigrants | Venezuela | 49.2 /100 | #175 | Average 31.7% |
| Scottish | 48.1 /100 | #176 | Average 31.7% |
Demographics Similar to Immigrants from Latvia by Births to Unmarried Women
In terms of births to unmarried women, the demographic groups most similar to Immigrants from Latvia are Immigrants from Saudi Arabia (29.1%, a difference of 0.16%), Immigrants from Fiji (29.2%, a difference of 0.21%), Arab (29.2%, a difference of 0.25%), Estonian (29.2%, a difference of 0.29%), and Ukrainian (29.2%, a difference of 0.41%).
| Demographics | Rating | Rank | Births to Unmarried Women |
| Immigrants | Kuwait | 98.0 /100 | #83 | Exceptional 28.8% |
| Immigrants | Poland | 97.6 /100 | #84 | Exceptional 28.9% |
| Sri Lankans | 97.5 /100 | #85 | Exceptional 28.9% |
| Immigrants | Jordan | 97.4 /100 | #86 | Exceptional 29.0% |
| Taiwanese | 97.3 /100 | #87 | Exceptional 29.0% |
| Immigrants | France | 97.3 /100 | #88 | Exceptional 29.0% |
| Immigrants | Saudi Arabia | 97.0 /100 | #89 | Exceptional 29.1% |
| Immigrants | Latvia | 96.8 /100 | #90 | Exceptional 29.1% |
| Immigrants | Fiji | 96.6 /100 | #91 | Exceptional 29.2% |
| Arabs | 96.5 /100 | #92 | Exceptional 29.2% |
| Estonians | 96.5 /100 | #93 | Exceptional 29.2% |
| Ukrainians | 96.3 /100 | #94 | Exceptional 29.2% |
| Immigrants | Vietnam | 96.1 /100 | #95 | Exceptional 29.3% |
| Norwegians | 95.8 /100 | #96 | Exceptional 29.3% |
| Immigrants | South Africa | 95.7 /100 | #97 | Exceptional 29.3% |