Iranian vs Russian Single Mother Households
COMPARE
Iranian
Russian
Single Mother Households
Single Mother Households Comparison
Iranians
Russians
5.0%
SINGLE MOTHER HOUSEHOLDS
100.0/ 100
METRIC RATING
7th/ 347
METRIC RANK
5.3%
SINGLE MOTHER HOUSEHOLDS
99.7/ 100
METRIC RATING
28th/ 347
METRIC RANK
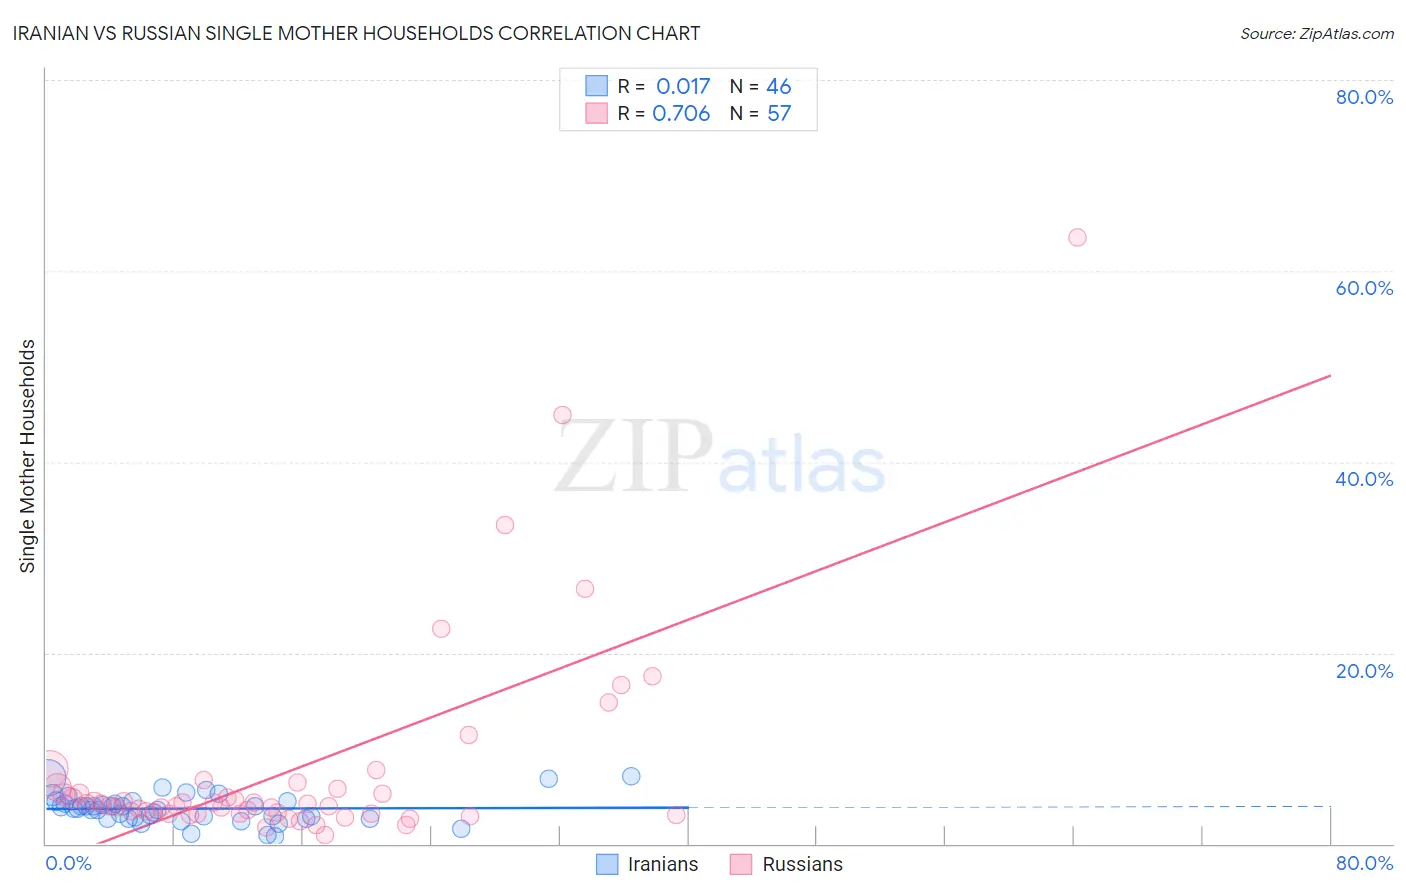
Iranian vs Russian Single Mother Households Correlation Chart
The statistical analysis conducted on geographies consisting of 316,158,075 people shows no correlation between the proportion of Iranians and percentage of single mother households in the United States with a correlation coefficient (R) of 0.017 and weighted average of 5.0%. Similarly, the statistical analysis conducted on geographies consisting of 509,106,631 people shows a strong positive correlation between the proportion of Russians and percentage of single mother households in the United States with a correlation coefficient (R) of 0.706 and weighted average of 5.3%, a difference of 6.3%.
Single Mother Households Correlation Summary
| Measurement | Iranian | Russian |
| Minimum | 0.85% | 0.89% |
| Maximum | 7.1% | 63.5% |
| Range | 6.3% | 62.6% |
| Mean | 3.7% | 7.8% |
| Median | 3.7% | 4.2% |
| Interquartile 25% (IQ1) | 2.7% | 3.2% |
| Interquartile 75% (IQ3) | 4.4% | 5.8% |
| Interquartile Range (IQR) | 1.8% | 2.6% |
| Standard Deviation (Sample) | 1.5% | 11.0% |
| Standard Deviation (Population) | 1.5% | 10.9% |
Similar Demographics by Single Mother Households
Demographics Similar to Iranians by Single Mother Households
In terms of single mother households, the demographic groups most similar to Iranians are Immigrants from Singapore (5.0%, a difference of 0.25%), Immigrants from Ireland (5.0%, a difference of 0.66%), Okinawan (5.0%, a difference of 0.81%), Immigrants from Israel (5.0%, a difference of 1.1%), and Immigrants from China (5.1%, a difference of 1.8%).
| Demographics | Rating | Rank | Single Mother Households |
| Immigrants | Taiwan | 100.0 /100 | #1 | Exceptional 4.7% |
| Filipinos | 100.0 /100 | #2 | Exceptional 4.7% |
| Immigrants | Iran | 100.0 /100 | #3 | Exceptional 4.8% |
| Assyrians/Chaldeans/Syriacs | 100.0 /100 | #4 | Exceptional 4.8% |
| Immigrants | Hong Kong | 100.0 /100 | #5 | Exceptional 4.8% |
| Immigrants | Singapore | 100.0 /100 | #6 | Exceptional 5.0% |
| Iranians | 100.0 /100 | #7 | Exceptional 5.0% |
| Immigrants | Ireland | 99.9 /100 | #8 | Exceptional 5.0% |
| Okinawans | 99.9 /100 | #9 | Exceptional 5.0% |
| Immigrants | Israel | 99.9 /100 | #10 | Exceptional 5.0% |
| Immigrants | China | 99.9 /100 | #11 | Exceptional 5.1% |
| Cypriots | 99.9 /100 | #12 | Exceptional 5.1% |
| Immigrants | India | 99.9 /100 | #13 | Exceptional 5.1% |
| Immigrants | Australia | 99.9 /100 | #14 | Exceptional 5.1% |
| Immigrants | Eastern Asia | 99.9 /100 | #15 | Exceptional 5.1% |
Demographics Similar to Russians by Single Mother Households
In terms of single mother households, the demographic groups most similar to Russians are Latvian (5.3%, a difference of 0.010%), Burmese (5.3%, a difference of 0.080%), Immigrants from Korea (5.3%, a difference of 0.080%), Cambodian (5.3%, a difference of 0.090%), and Bhutanese (5.3%, a difference of 0.10%).
| Demographics | Rating | Rank | Single Mother Households |
| Eastern Europeans | 99.8 /100 | #21 | Exceptional 5.2% |
| Thais | 99.8 /100 | #22 | Exceptional 5.2% |
| Immigrants | Austria | 99.8 /100 | #23 | Exceptional 5.2% |
| Armenians | 99.8 /100 | #24 | Exceptional 5.2% |
| Immigrants | Japan | 99.8 /100 | #25 | Exceptional 5.2% |
| Immigrants | Lithuania | 99.8 /100 | #26 | Exceptional 5.3% |
| Bhutanese | 99.7 /100 | #27 | Exceptional 5.3% |
| Russians | 99.7 /100 | #28 | Exceptional 5.3% |
| Latvians | 99.7 /100 | #29 | Exceptional 5.3% |
| Burmese | 99.7 /100 | #30 | Exceptional 5.3% |
| Immigrants | Korea | 99.7 /100 | #31 | Exceptional 5.3% |
| Cambodians | 99.7 /100 | #32 | Exceptional 5.3% |
| Immigrants | Switzerland | 99.7 /100 | #33 | Exceptional 5.3% |
| Bulgarians | 99.7 /100 | #34 | Exceptional 5.3% |
| Immigrants | Northern Europe | 99.7 /100 | #35 | Exceptional 5.3% |