Salvadoran vs Immigrants from Barbados Currently Married
COMPARE
Salvadoran
Immigrants from Barbados
Currently Married
Currently Married Comparison
Salvadorans
Immigrants from Barbados
43.5%
CURRENTLY MARRIED
0.1/ 100
METRIC RATING
270th/ 347
METRIC RANK
40.3%
CURRENTLY MARRIED
0.0/ 100
METRIC RATING
331st/ 347
METRIC RANK
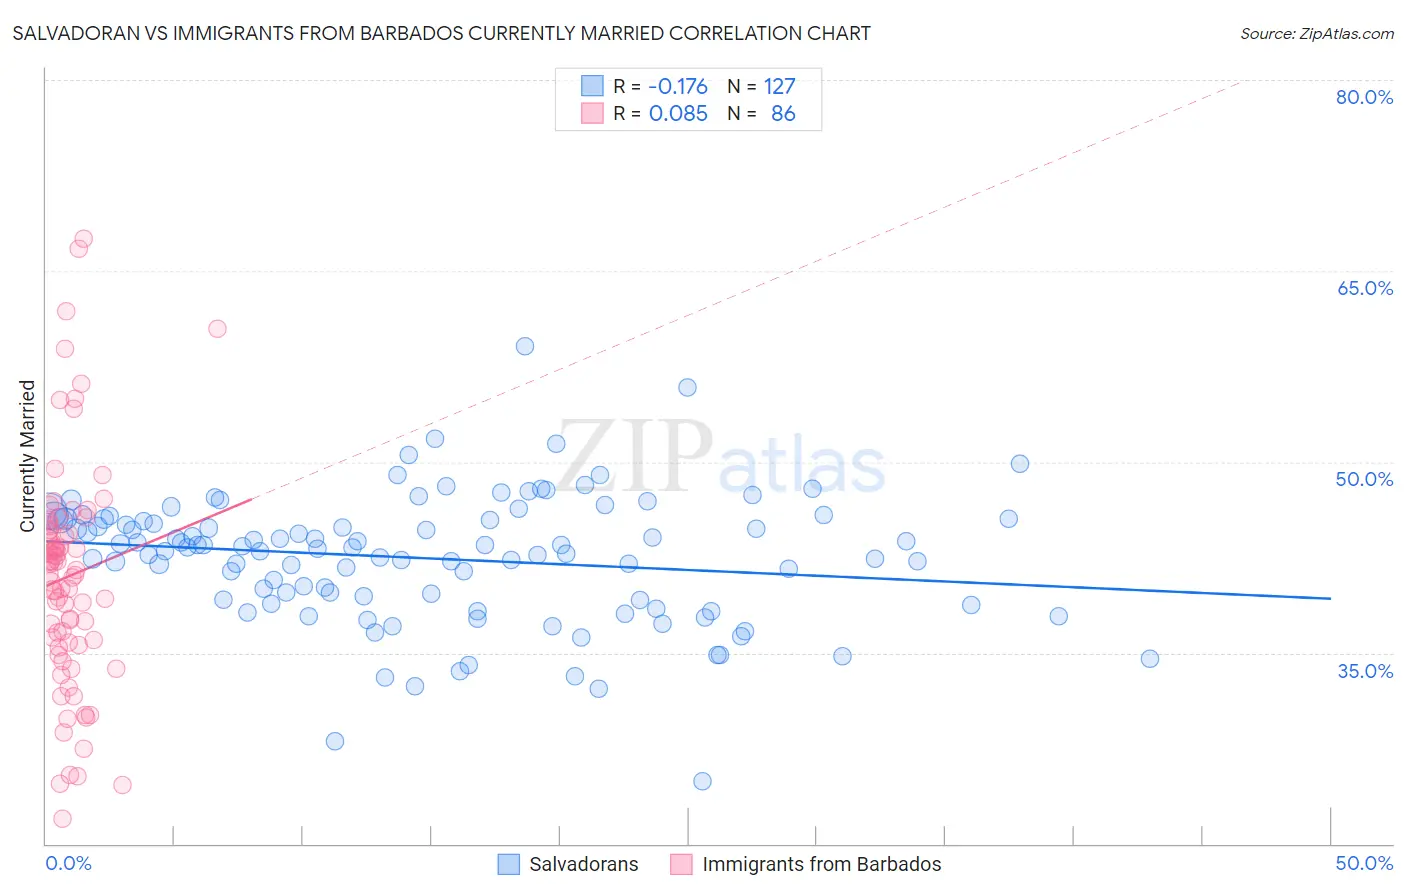
Salvadoran vs Immigrants from Barbados Currently Married Correlation Chart
The statistical analysis conducted on geographies consisting of 399,003,710 people shows a poor negative correlation between the proportion of Salvadorans and percentage of population currently married in the United States with a correlation coefficient (R) of -0.176 and weighted average of 43.5%. Similarly, the statistical analysis conducted on geographies consisting of 112,780,332 people shows a slight positive correlation between the proportion of Immigrants from Barbados and percentage of population currently married in the United States with a correlation coefficient (R) of 0.085 and weighted average of 40.3%, a difference of 7.8%.
Currently Married Correlation Summary
| Measurement | Salvadoran | Immigrants from Barbados |
| Minimum | 24.9% | 22.0% |
| Maximum | 59.1% | 67.5% |
| Range | 34.2% | 45.5% |
| Mean | 42.4% | 41.0% |
| Median | 43.2% | 41.3% |
| Interquartile 25% (IQ1) | 39.1% | 35.8% |
| Interquartile 75% (IQ3) | 45.5% | 44.6% |
| Interquartile Range (IQR) | 6.4% | 8.9% |
| Standard Deviation (Sample) | 5.1% | 8.9% |
| Standard Deviation (Population) | 5.0% | 8.9% |
Similar Demographics by Currently Married
Demographics Similar to Salvadorans by Currently Married
In terms of currently married, the demographic groups most similar to Salvadorans are Bermudan (43.5%, a difference of 0.020%), Indonesian (43.5%, a difference of 0.050%), Immigrants from Sudan (43.5%, a difference of 0.080%), Yaqui (43.4%, a difference of 0.10%), and Nigerian (43.4%, a difference of 0.11%).
| Demographics | Rating | Rank | Currently Married |
| Immigrants | Cuba | 0.1 /100 | #263 | Tragic 43.7% |
| Sudanese | 0.1 /100 | #264 | Tragic 43.7% |
| Immigrants | Bangladesh | 0.1 /100 | #265 | Tragic 43.6% |
| Ecuadorians | 0.1 /100 | #266 | Tragic 43.6% |
| Immigrants | Eritrea | 0.1 /100 | #267 | Tragic 43.6% |
| Spanish American Indians | 0.1 /100 | #268 | Tragic 43.6% |
| Immigrants | Sudan | 0.1 /100 | #269 | Tragic 43.5% |
| Salvadorans | 0.1 /100 | #270 | Tragic 43.5% |
| Bermudans | 0.1 /100 | #271 | Tragic 43.5% |
| Indonesians | 0.1 /100 | #272 | Tragic 43.5% |
| Yaqui | 0.1 /100 | #273 | Tragic 43.4% |
| Nigerians | 0.1 /100 | #274 | Tragic 43.4% |
| Colville | 0.1 /100 | #275 | Tragic 43.4% |
| Sierra Leoneans | 0.1 /100 | #276 | Tragic 43.4% |
| Immigrants | Nigeria | 0.1 /100 | #277 | Tragic 43.4% |
Demographics Similar to Immigrants from Barbados by Currently Married
In terms of currently married, the demographic groups most similar to Immigrants from Barbados are Immigrants from Dominica (40.3%, a difference of 0.020%), Crow (40.4%, a difference of 0.10%), Arapaho (40.5%, a difference of 0.53%), Senegalese (40.6%, a difference of 0.58%), and Immigrants from St. Vincent and the Grenadines (40.1%, a difference of 0.67%).
| Demographics | Rating | Rank | Currently Married |
| Immigrants | Senegal | 0.0 /100 | #324 | Tragic 40.7% |
| U.S. Virgin Islanders | 0.0 /100 | #325 | Tragic 40.7% |
| Barbadians | 0.0 /100 | #326 | Tragic 40.6% |
| Senegalese | 0.0 /100 | #327 | Tragic 40.6% |
| Arapaho | 0.0 /100 | #328 | Tragic 40.5% |
| Crow | 0.0 /100 | #329 | Tragic 40.4% |
| Immigrants | Dominica | 0.0 /100 | #330 | Tragic 40.3% |
| Immigrants | Barbados | 0.0 /100 | #331 | Tragic 40.3% |
| Immigrants | St. Vincent and the Grenadines | 0.0 /100 | #332 | Tragic 40.1% |
| Yup'ik | 0.0 /100 | #333 | Tragic 39.9% |
| Puerto Ricans | 0.0 /100 | #334 | Tragic 39.9% |
| Lumbee | 0.0 /100 | #335 | Tragic 39.8% |
| British West Indians | 0.0 /100 | #336 | Tragic 39.8% |
| Blacks/African Americans | 0.0 /100 | #337 | Tragic 39.6% |
| Cape Verdeans | 0.0 /100 | #338 | Tragic 39.6% |