Ottawa vs Yaqui Average Family Size
COMPARE
Ottawa
Yaqui
Average Family Size
Average Family Size Comparison
Ottawa
Yaqui
3.11
AVERAGE FAMILY SIZE
0.0/ 100
METRIC RATING
326th/ 347
METRIC RANK
3.32
AVERAGE FAMILY SIZE
99.9/ 100
METRIC RATING
73rd/ 347
METRIC RANK
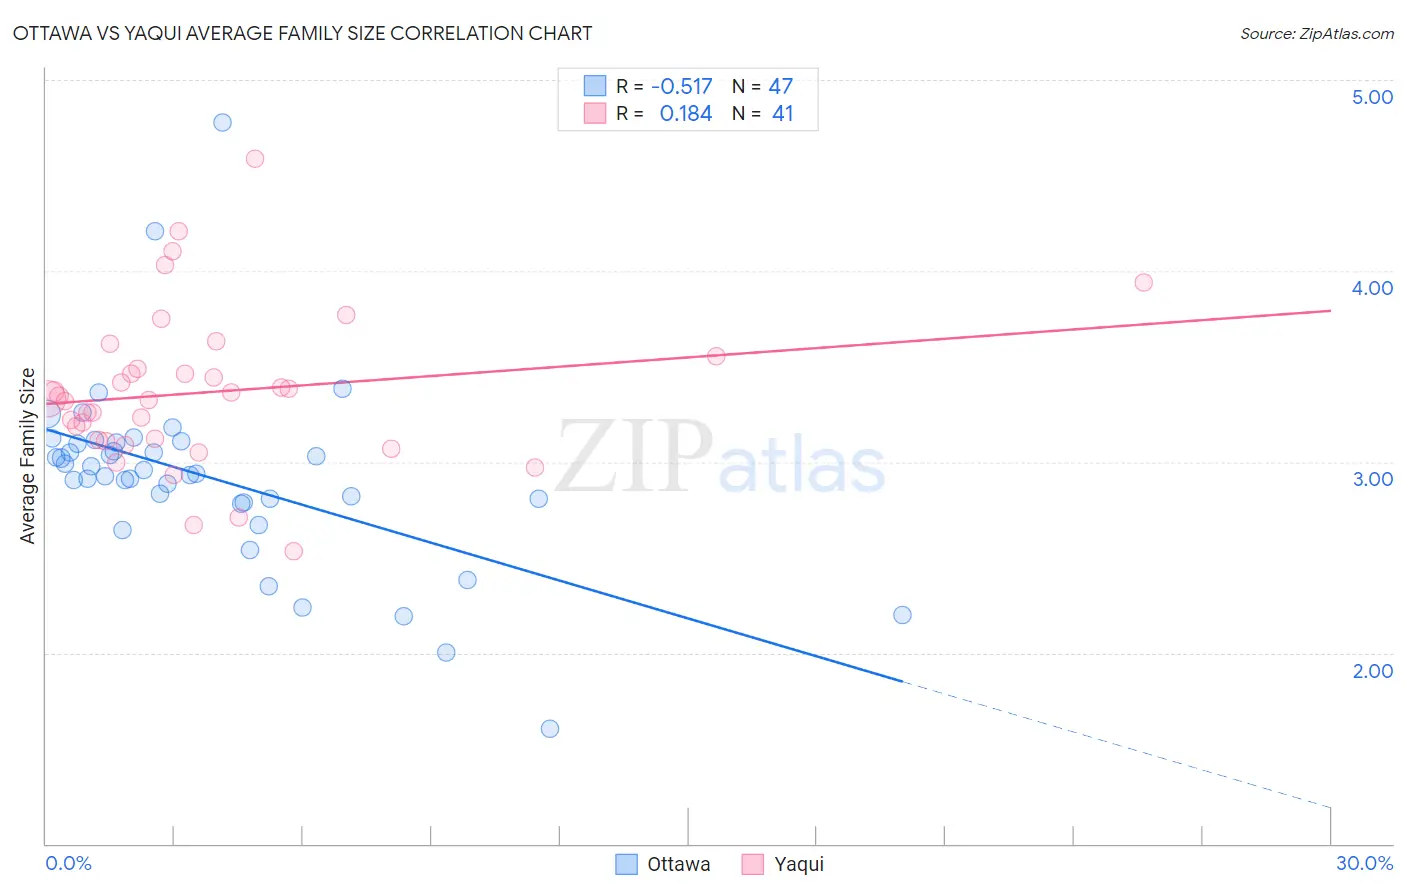
Ottawa vs Yaqui Average Family Size Correlation Chart
The statistical analysis conducted on geographies consisting of 49,944,420 people shows a substantial negative correlation between the proportion of Ottawa and average family size in the United States with a correlation coefficient (R) of -0.517 and weighted average of 3.11. Similarly, the statistical analysis conducted on geographies consisting of 107,720,236 people shows a poor positive correlation between the proportion of Yaqui and average family size in the United States with a correlation coefficient (R) of 0.184 and weighted average of 3.32, a difference of 6.9%.
Average Family Size Correlation Summary
| Measurement | Ottawa | Yaqui |
| Minimum | 1.60 | 2.53 |
| Maximum | 4.78 | 4.58 |
| Range | 3.18 | 2.05 |
| Mean | 2.92 | 3.37 |
| Median | 2.94 | 3.33 |
| Interquartile 25% (IQ1) | 2.79 | 3.11 |
| Interquartile 75% (IQ3) | 3.10 | 3.52 |
| Interquartile Range (IQR) | 0.31 | 0.41 |
| Standard Deviation (Sample) | 0.49 | 0.41 |
| Standard Deviation (Population) | 0.49 | 0.40 |
Similar Demographics by Average Family Size
Demographics Similar to Ottawa by Average Family Size
In terms of average family size, the demographic groups most similar to Ottawa are Dutch (3.11, a difference of 0.010%), Czech (3.11, a difference of 0.010%), English (3.11, a difference of 0.050%), Belgian (3.11, a difference of 0.070%), and Celtic (3.11, a difference of 0.090%).
| Demographics | Rating | Rank | Average Family Size |
| Welsh | 0.1 /100 | #319 | Tragic 3.12 |
| Immigrants | North America | 0.0 /100 | #320 | Tragic 3.12 |
| Immigrants | Austria | 0.0 /100 | #321 | Tragic 3.12 |
| Immigrants | Canada | 0.0 /100 | #322 | Tragic 3.12 |
| Soviet Union | 0.0 /100 | #323 | Tragic 3.11 |
| Celtics | 0.0 /100 | #324 | Tragic 3.11 |
| English | 0.0 /100 | #325 | Tragic 3.11 |
| Ottawa | 0.0 /100 | #326 | Tragic 3.11 |
| Dutch | 0.0 /100 | #327 | Tragic 3.11 |
| Czechs | 0.0 /100 | #328 | Tragic 3.11 |
| Belgians | 0.0 /100 | #329 | Tragic 3.11 |
| Latvians | 0.0 /100 | #330 | Tragic 3.11 |
| Scotch-Irish | 0.0 /100 | #331 | Tragic 3.11 |
| Scottish | 0.0 /100 | #332 | Tragic 3.11 |
| Estonians | 0.0 /100 | #333 | Tragic 3.10 |
Demographics Similar to Yaqui by Average Family Size
In terms of average family size, the demographic groups most similar to Yaqui are Immigrants from Caribbean (3.33, a difference of 0.030%), Immigrants from Sierra Leone (3.32, a difference of 0.030%), Immigrants from Barbados (3.32, a difference of 0.060%), Trinidadian and Tobagonian (3.32, a difference of 0.080%), and Immigrants from Ecuador (3.32, a difference of 0.090%).
| Demographics | Rating | Rank | Average Family Size |
| Immigrants | St. Vincent and the Grenadines | 99.9 /100 | #66 | Exceptional 3.34 |
| Immigrants | Jamaica | 99.9 /100 | #67 | Exceptional 3.33 |
| Immigrants | Cambodia | 99.9 /100 | #68 | Exceptional 3.33 |
| Immigrants | Immigrants | 99.9 /100 | #69 | Exceptional 3.33 |
| Immigrants | Trinidad and Tobago | 99.9 /100 | #70 | Exceptional 3.33 |
| Immigrants | West Indies | 99.9 /100 | #71 | Exceptional 3.33 |
| Immigrants | Caribbean | 99.9 /100 | #72 | Exceptional 3.33 |
| Yaqui | 99.9 /100 | #73 | Exceptional 3.32 |
| Immigrants | Sierra Leone | 99.9 /100 | #74 | Exceptional 3.32 |
| Immigrants | Barbados | 99.8 /100 | #75 | Exceptional 3.32 |
| Trinidadians and Tobagonians | 99.8 /100 | #76 | Exceptional 3.32 |
| Immigrants | Ecuador | 99.8 /100 | #77 | Exceptional 3.32 |
| Immigrants | Micronesia | 99.8 /100 | #78 | Exceptional 3.32 |
| British West Indians | 99.8 /100 | #79 | Exceptional 3.32 |
| Lumbee | 99.8 /100 | #80 | Exceptional 3.32 |