Croatian vs Sierra Leonean Average Family Size
COMPARE
Croatian
Sierra Leonean
Average Family Size
Average Family Size Comparison
Croatians
Sierra Leoneans
3.10
AVERAGE FAMILY SIZE
0.0/ 100
METRIC RATING
339th/ 347
METRIC RANK
3.30
AVERAGE FAMILY SIZE
99.0/ 100
METRIC RATING
94th/ 347
METRIC RANK
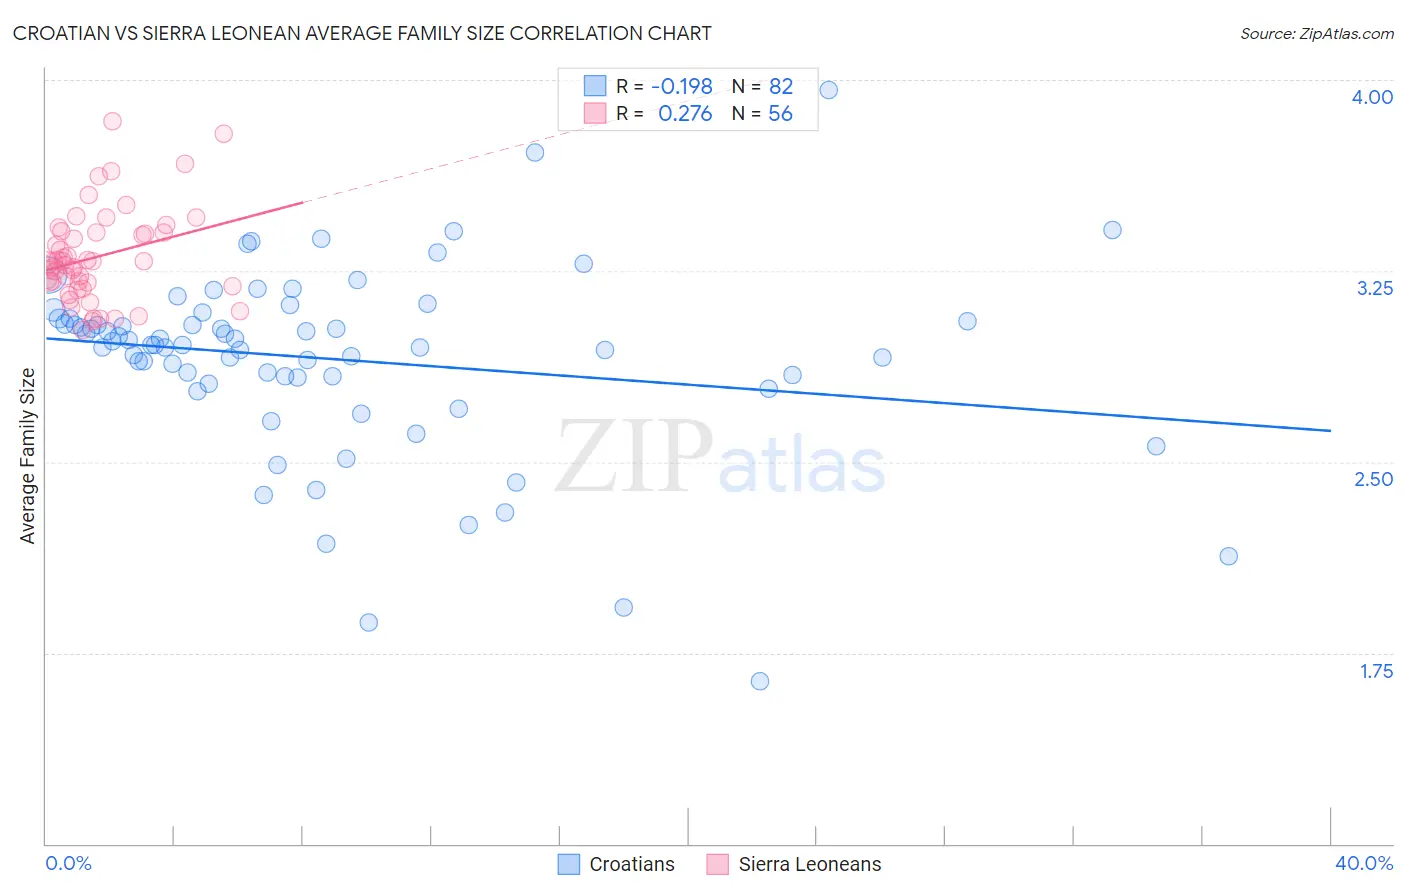
Croatian vs Sierra Leonean Average Family Size Correlation Chart
The statistical analysis conducted on geographies consisting of 375,543,133 people shows a poor negative correlation between the proportion of Croatians and average family size in the United States with a correlation coefficient (R) of -0.198 and weighted average of 3.10. Similarly, the statistical analysis conducted on geographies consisting of 83,343,424 people shows a weak positive correlation between the proportion of Sierra Leoneans and average family size in the United States with a correlation coefficient (R) of 0.276 and weighted average of 3.30, a difference of 6.4%.
Average Family Size Correlation Summary
| Measurement | Croatian | Sierra Leonean |
| Minimum | 1.64 | 3.02 |
| Maximum | 3.96 | 3.84 |
| Range | 2.32 | 0.82 |
| Mean | 2.90 | 3.31 |
| Median | 2.96 | 3.28 |
| Interquartile 25% (IQ1) | 2.83 | 3.20 |
| Interquartile 75% (IQ3) | 3.06 | 3.40 |
| Interquartile Range (IQR) | 0.23 | 0.20 |
| Standard Deviation (Sample) | 0.37 | 0.18 |
| Standard Deviation (Population) | 0.37 | 0.18 |
Similar Demographics by Average Family Size
Demographics Similar to Croatians by Average Family Size
In terms of average family size, the demographic groups most similar to Croatians are French (3.10, a difference of 0.010%), Swedish (3.10, a difference of 0.030%), Irish (3.10, a difference of 0.070%), Luxembourger (3.10, a difference of 0.13%), and Finnish (3.09, a difference of 0.14%).
| Demographics | Rating | Rank | Average Family Size |
| Scottish | 0.0 /100 | #332 | Tragic 3.11 |
| Estonians | 0.0 /100 | #333 | Tragic 3.10 |
| Lithuanians | 0.0 /100 | #334 | Tragic 3.10 |
| Luxembourgers | 0.0 /100 | #335 | Tragic 3.10 |
| Irish | 0.0 /100 | #336 | Tragic 3.10 |
| Swedes | 0.0 /100 | #337 | Tragic 3.10 |
| French | 0.0 /100 | #338 | Tragic 3.10 |
| Croatians | 0.0 /100 | #339 | Tragic 3.10 |
| Finns | 0.0 /100 | #340 | Tragic 3.09 |
| Poles | 0.0 /100 | #341 | Tragic 3.09 |
| Germans | 0.0 /100 | #342 | Tragic 3.09 |
| Norwegians | 0.0 /100 | #343 | Tragic 3.08 |
| French Canadians | 0.0 /100 | #344 | Tragic 3.07 |
| Slovenes | 0.0 /100 | #345 | Tragic 3.07 |
| Slovaks | 0.0 /100 | #346 | Tragic 3.06 |
Demographics Similar to Sierra Leoneans by Average Family Size
In terms of average family size, the demographic groups most similar to Sierra Leoneans are Immigrants from Lebanon (3.30, a difference of 0.010%), U.S. Virgin Islander (3.29, a difference of 0.090%), Peruvian (3.30, a difference of 0.10%), Immigrants from Cameroon (3.30, a difference of 0.11%), and Immigrants from Pakistan (3.30, a difference of 0.12%).
| Demographics | Rating | Rank | Average Family Size |
| Immigrants | Peru | 99.7 /100 | #87 | Exceptional 3.31 |
| Immigrants | Bolivia | 99.6 /100 | #88 | Exceptional 3.31 |
| Malaysians | 99.6 /100 | #89 | Exceptional 3.31 |
| Menominee | 99.4 /100 | #90 | Exceptional 3.30 |
| Immigrants | Pakistan | 99.2 /100 | #91 | Exceptional 3.30 |
| Immigrants | Cameroon | 99.2 /100 | #92 | Exceptional 3.30 |
| Peruvians | 99.2 /100 | #93 | Exceptional 3.30 |
| Sierra Leoneans | 99.0 /100 | #94 | Exceptional 3.30 |
| Immigrants | Lebanon | 99.0 /100 | #95 | Exceptional 3.30 |
| U.S. Virgin Islanders | 98.8 /100 | #96 | Exceptional 3.29 |
| Immigrants | Oceania | 98.7 /100 | #97 | Exceptional 3.29 |
| Barbadians | 98.6 /100 | #98 | Exceptional 3.29 |
| Nigerians | 98.6 /100 | #99 | Exceptional 3.29 |
| Guamanians/Chamorros | 98.6 /100 | #100 | Exceptional 3.29 |
| Immigrants | Burma/Myanmar | 98.6 /100 | #101 | Exceptional 3.29 |