Immigrants from Liberia vs Immigrants from Iraq Family Households
COMPARE
Immigrants from Liberia
Immigrants from Iraq
Family Households
Family Households Comparison
Immigrants from Liberia
Immigrants from Iraq
62.0%
FAMILY HOUSEHOLDS
0.0/ 100
METRIC RATING
310th/ 347
METRIC RANK
65.0%
FAMILY HOUSEHOLDS
95.4/ 100
METRIC RATING
116th/ 347
METRIC RANK
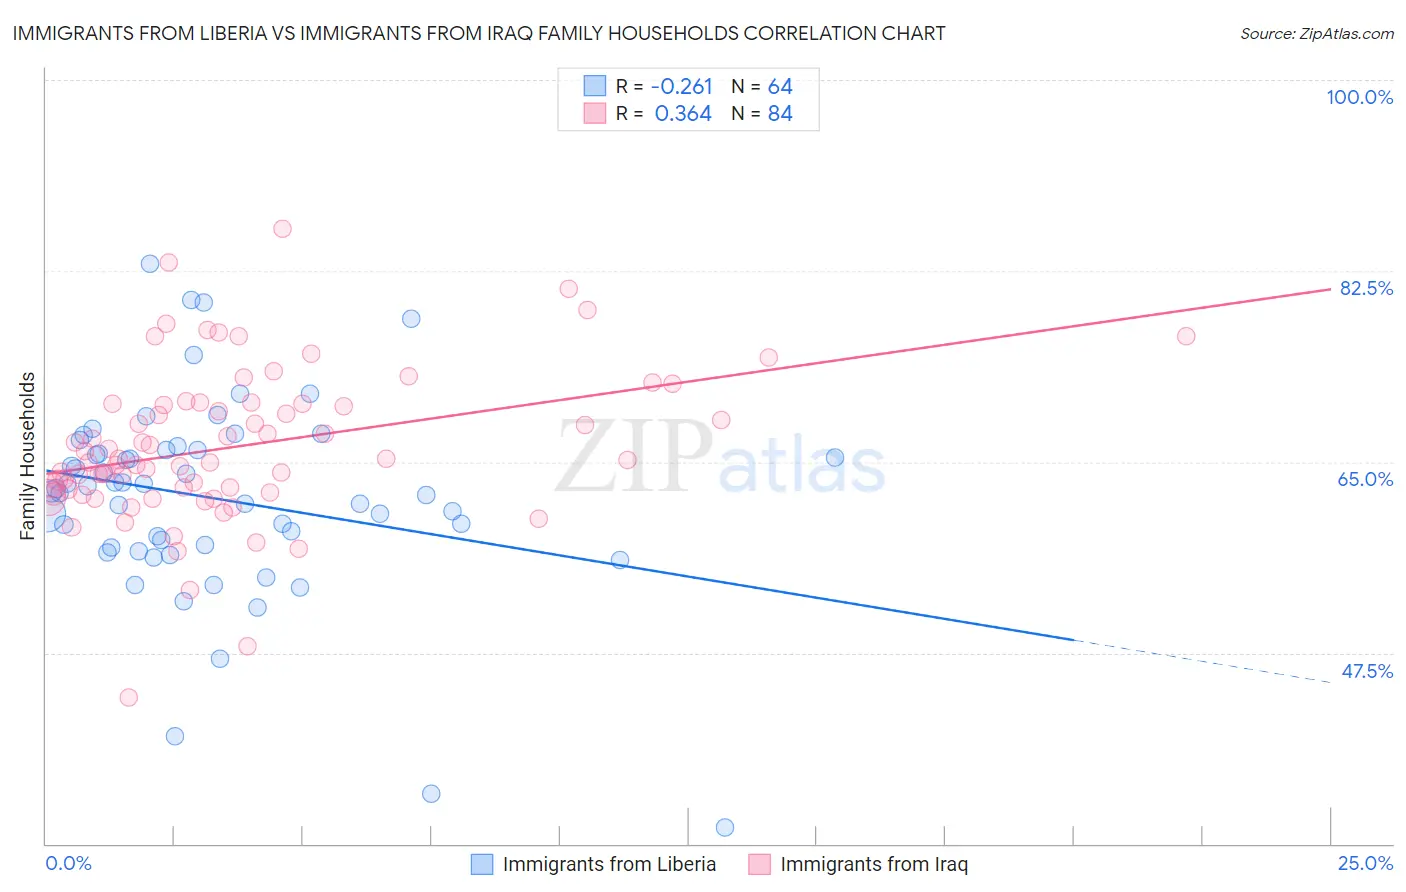
Immigrants from Liberia vs Immigrants from Iraq Family Households Correlation Chart
The statistical analysis conducted on geographies consisting of 135,243,454 people shows a weak negative correlation between the proportion of Immigrants from Liberia and percentage of family households in the United States with a correlation coefficient (R) of -0.261 and weighted average of 62.0%. Similarly, the statistical analysis conducted on geographies consisting of 194,748,040 people shows a mild positive correlation between the proportion of Immigrants from Iraq and percentage of family households in the United States with a correlation coefficient (R) of 0.364 and weighted average of 65.0%, a difference of 4.7%.
Family Households Correlation Summary
| Measurement | Immigrants from Liberia | Immigrants from Iraq |
| Minimum | 31.5% | 43.4% |
| Maximum | 83.2% | 86.3% |
| Range | 51.7% | 43.0% |
| Mean | 61.7% | 66.4% |
| Median | 62.4% | 65.2% |
| Interquartile 25% (IQ1) | 57.3% | 62.3% |
| Interquartile 75% (IQ3) | 66.1% | 70.4% |
| Interquartile Range (IQR) | 8.8% | 8.0% |
| Standard Deviation (Sample) | 9.1% | 7.1% |
| Standard Deviation (Population) | 9.0% | 7.0% |
Similar Demographics by Family Households
Demographics Similar to Immigrants from Liberia by Family Households
In terms of family households, the demographic groups most similar to Immigrants from Liberia are Immigrants from Morocco (62.0%, a difference of 0.030%), Subsaharan African (62.1%, a difference of 0.040%), Immigrants from Latvia (62.0%, a difference of 0.080%), Liberian (62.0%, a difference of 0.080%), and Immigrants from Norway (62.1%, a difference of 0.10%).
| Demographics | Rating | Rank | Family Households |
| Cree | 0.0 /100 | #303 | Tragic 62.3% |
| Iroquois | 0.0 /100 | #304 | Tragic 62.2% |
| Bermudans | 0.0 /100 | #305 | Tragic 62.2% |
| Africans | 0.0 /100 | #306 | Tragic 62.1% |
| Immigrants | Norway | 0.0 /100 | #307 | Tragic 62.1% |
| Chippewa | 0.0 /100 | #308 | Tragic 62.1% |
| Sub-Saharan Africans | 0.0 /100 | #309 | Tragic 62.1% |
| Immigrants | Liberia | 0.0 /100 | #310 | Tragic 62.0% |
| Immigrants | Morocco | 0.0 /100 | #311 | Tragic 62.0% |
| Immigrants | Latvia | 0.0 /100 | #312 | Tragic 62.0% |
| Liberians | 0.0 /100 | #313 | Tragic 62.0% |
| Immigrants | Cabo Verde | 0.0 /100 | #314 | Tragic 61.9% |
| Moroccans | 0.0 /100 | #315 | Tragic 61.9% |
| Immigrants | Middle Africa | 0.0 /100 | #316 | Tragic 61.9% |
| Immigrants | Bosnia and Herzegovina | 0.0 /100 | #317 | Tragic 61.9% |
Demographics Similar to Immigrants from Iraq by Family Households
In terms of family households, the demographic groups most similar to Immigrants from Iraq are Ecuadorian (65.0%, a difference of 0.0%), Cherokee (65.0%, a difference of 0.0%), Dutch (64.9%, a difference of 0.020%), Argentinean (65.0%, a difference of 0.030%), and Spanish (65.0%, a difference of 0.070%).
| Demographics | Rating | Rank | Family Households |
| Immigrants | Guatemala | 96.9 /100 | #109 | Exceptional 65.0% |
| Scandinavians | 96.8 /100 | #110 | Exceptional 65.0% |
| Europeans | 96.8 /100 | #111 | Exceptional 65.0% |
| Immigrants | Jordan | 96.5 /100 | #112 | Exceptional 65.0% |
| Spanish | 96.2 /100 | #113 | Exceptional 65.0% |
| Argentineans | 95.7 /100 | #114 | Exceptional 65.0% |
| Ecuadorians | 95.4 /100 | #115 | Exceptional 65.0% |
| Immigrants | Iraq | 95.4 /100 | #116 | Exceptional 65.0% |
| Cherokee | 95.3 /100 | #117 | Exceptional 65.0% |
| Dutch | 95.1 /100 | #118 | Exceptional 64.9% |
| Immigrants | Eastern Asia | 94.4 /100 | #119 | Exceptional 64.9% |
| Immigrants | Oceania | 94.2 /100 | #120 | Exceptional 64.9% |
| Hungarians | 94.0 /100 | #121 | Exceptional 64.9% |
| Hmong | 93.4 /100 | #122 | Exceptional 64.9% |
| Choctaw | 93.4 /100 | #123 | Exceptional 64.9% |