Serbian vs Immigrants from Iraq College, 1 year or more
COMPARE
Serbian
Immigrants from Iraq
College, 1 year or more
College, 1 year or more Comparison
Serbians
Immigrants from Iraq
61.4%
COLLEGE, 1 YEAR OR MORE
92.2/ 100
METRIC RATING
123rd/ 347
METRIC RANK
60.0%
COLLEGE, 1 YEAR OR MORE
67.0/ 100
METRIC RATING
159th/ 347
METRIC RANK
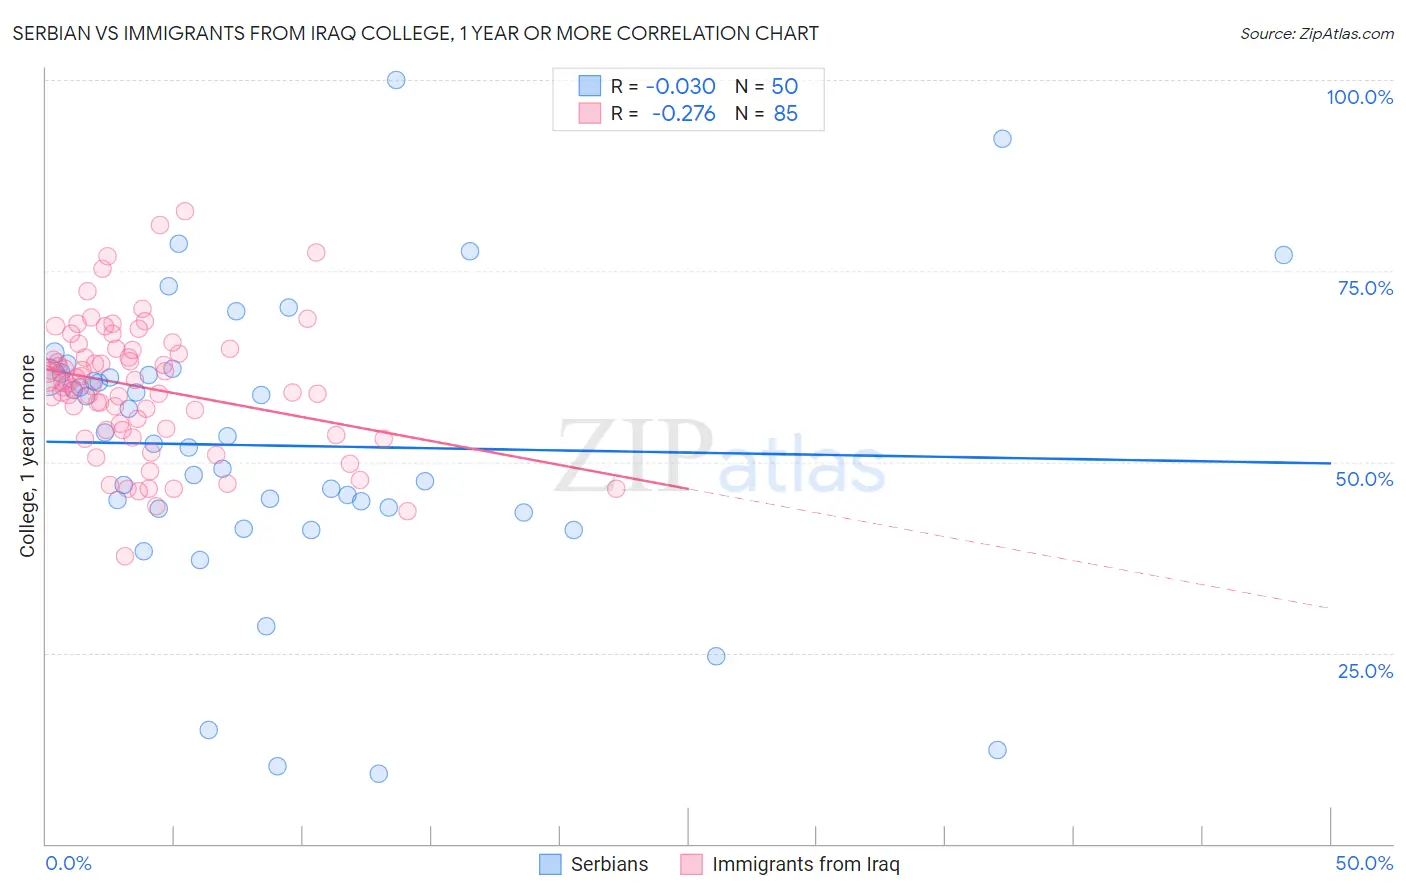
Serbian vs Immigrants from Iraq College, 1 year or more Correlation Chart
The statistical analysis conducted on geographies consisting of 267,640,905 people shows no correlation between the proportion of Serbians and percentage of population with at least college, 1 year or more education in the United States with a correlation coefficient (R) of -0.030 and weighted average of 61.4%. Similarly, the statistical analysis conducted on geographies consisting of 194,780,026 people shows a weak negative correlation between the proportion of Immigrants from Iraq and percentage of population with at least college, 1 year or more education in the United States with a correlation coefficient (R) of -0.276 and weighted average of 60.0%, a difference of 2.3%.
College, 1 year or more Correlation Summary
| Measurement | Serbian | Immigrants from Iraq |
| Minimum | 9.2% | 37.6% |
| Maximum | 100.0% | 82.9% |
| Range | 90.8% | 45.3% |
| Mean | 52.1% | 59.7% |
| Median | 52.9% | 60.2% |
| Interquartile 25% (IQ1) | 43.9% | 54.1% |
| Interquartile 75% (IQ3) | 61.3% | 64.8% |
| Interquartile Range (IQR) | 17.4% | 10.6% |
| Standard Deviation (Sample) | 18.8% | 8.6% |
| Standard Deviation (Population) | 18.6% | 8.6% |
Similar Demographics by College, 1 year or more
Demographics Similar to Serbians by College, 1 year or more
In terms of college, 1 year or more, the demographic groups most similar to Serbians are Immigrants from Chile (61.4%, a difference of 0.010%), Venezuelan (61.3%, a difference of 0.030%), Immigrants from Jordan (61.4%, a difference of 0.10%), Immigrants from Syria (61.3%, a difference of 0.11%), and Alsatian (61.3%, a difference of 0.15%).
| Demographics | Rating | Rank | College, 1 year or more |
| Lebanese | 94.1 /100 | #116 | Exceptional 61.6% |
| Arabs | 93.9 /100 | #117 | Exceptional 61.6% |
| Immigrants | Brazil | 93.9 /100 | #118 | Exceptional 61.6% |
| Assyrians/Chaldeans/Syriacs | 93.3 /100 | #119 | Exceptional 61.5% |
| Pakistanis | 93.2 /100 | #120 | Exceptional 61.5% |
| Immigrants | Jordan | 92.7 /100 | #121 | Exceptional 61.4% |
| Immigrants | Chile | 92.3 /100 | #122 | Exceptional 61.4% |
| Serbians | 92.2 /100 | #123 | Exceptional 61.4% |
| Venezuelans | 92.1 /100 | #124 | Exceptional 61.3% |
| Immigrants | Syria | 91.6 /100 | #125 | Exceptional 61.3% |
| Alsatians | 91.3 /100 | #126 | Exceptional 61.3% |
| Immigrants | Eastern Africa | 91.1 /100 | #127 | Exceptional 61.2% |
| Immigrants | Italy | 91.1 /100 | #128 | Exceptional 61.2% |
| Ugandans | 90.7 /100 | #129 | Exceptional 61.2% |
| Italians | 89.5 /100 | #130 | Excellent 61.1% |
Demographics Similar to Immigrants from Iraq by College, 1 year or more
In terms of college, 1 year or more, the demographic groups most similar to Immigrants from Iraq are English (60.0%, a difference of 0.010%), South American Indian (60.0%, a difference of 0.010%), Immigrants from Armenia (60.0%, a difference of 0.11%), Somali (59.9%, a difference of 0.15%), and Sudanese (60.2%, a difference of 0.37%).
| Demographics | Rating | Rank | College, 1 year or more |
| Immigrants | Germany | 76.1 /100 | #152 | Good 60.3% |
| Sierra Leoneans | 74.1 /100 | #153 | Good 60.2% |
| Sudanese | 73.0 /100 | #154 | Good 60.2% |
| Moroccans | 72.9 /100 | #155 | Good 60.2% |
| Finns | 72.9 /100 | #156 | Good 60.2% |
| Immigrants | Armenia | 68.8 /100 | #157 | Good 60.0% |
| English | 67.2 /100 | #158 | Good 60.0% |
| Immigrants | Iraq | 67.0 /100 | #159 | Good 60.0% |
| South American Indians | 66.9 /100 | #160 | Good 60.0% |
| Somalis | 64.5 /100 | #161 | Good 59.9% |
| Koreans | 58.5 /100 | #162 | Average 59.7% |
| Immigrants | Somalia | 58.3 /100 | #163 | Average 59.7% |
| Belgians | 58.1 /100 | #164 | Average 59.7% |
| Irish | 56.1 /100 | #165 | Average 59.6% |
| Immigrants | Africa | 56.1 /100 | #166 | Average 59.6% |