Senegalese vs Immigrants from Switzerland Unemployment Among Ages 45 to 54 years
COMPARE
Senegalese
Immigrants from Switzerland
Unemployment Among Ages 45 to 54 years
Unemployment Among Ages 45 to 54 years Comparison
Senegalese
Immigrants from Switzerland
5.1%
UNEMPLOYMENT AMONG AGES 45 TO 54 YEARS
0.0/ 100
METRIC RATING
286th/ 347
METRIC RANK
4.6%
UNEMPLOYMENT AMONG AGES 45 TO 54 YEARS
14.0/ 100
METRIC RATING
206th/ 347
METRIC RANK
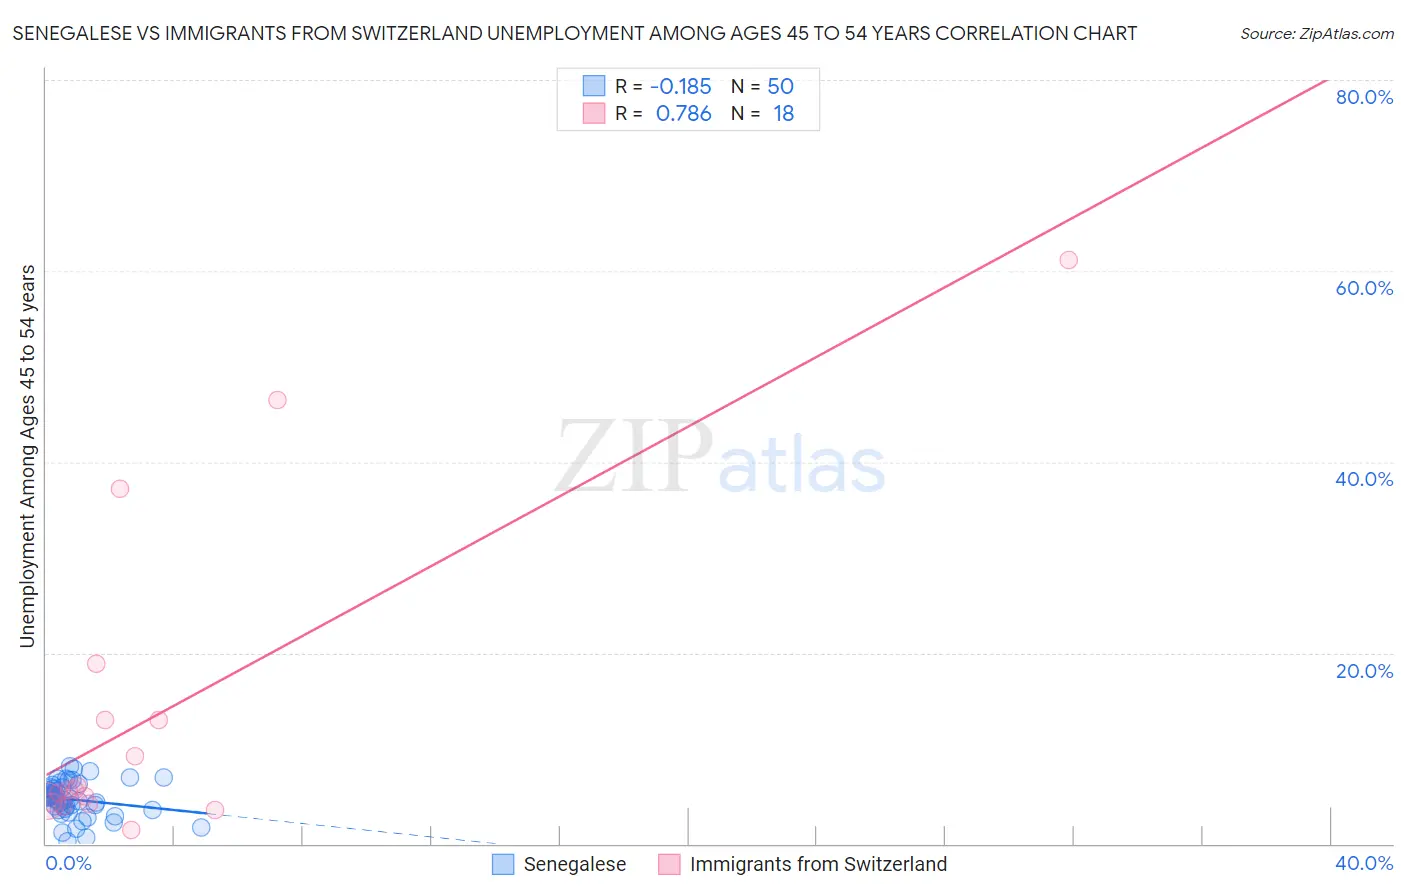
Senegalese vs Immigrants from Switzerland Unemployment Among Ages 45 to 54 years Correlation Chart
The statistical analysis conducted on geographies consisting of 77,807,393 people shows a poor negative correlation between the proportion of Senegalese and unemployment rate among population between the ages 45 and 54 in the United States with a correlation coefficient (R) of -0.185 and weighted average of 5.1%. Similarly, the statistical analysis conducted on geographies consisting of 146,494,644 people shows a strong positive correlation between the proportion of Immigrants from Switzerland and unemployment rate among population between the ages 45 and 54 in the United States with a correlation coefficient (R) of 0.786 and weighted average of 4.6%, a difference of 11.1%.
Unemployment Among Ages 45 to 54 years Correlation Summary
| Measurement | Senegalese | Immigrants from Switzerland |
| Minimum | 0.30% | 1.5% |
| Maximum | 8.1% | 61.1% |
| Range | 7.8% | 59.6% |
| Mean | 4.6% | 13.8% |
| Median | 4.7% | 5.6% |
| Interquartile 25% (IQ1) | 3.6% | 4.3% |
| Interquartile 75% (IQ3) | 5.9% | 13.0% |
| Interquartile Range (IQR) | 2.3% | 8.7% |
| Standard Deviation (Sample) | 1.8% | 16.9% |
| Standard Deviation (Population) | 1.8% | 16.4% |
Similar Demographics by Unemployment Among Ages 45 to 54 years
Demographics Similar to Senegalese by Unemployment Among Ages 45 to 54 years
In terms of unemployment among ages 45 to 54 years, the demographic groups most similar to Senegalese are Iroquois (5.1%, a difference of 0.16%), Kiowa (5.1%, a difference of 0.18%), Hispanic or Latino (5.1%, a difference of 0.83%), Haitian (5.2%, a difference of 0.83%), and Immigrants from Caribbean (5.2%, a difference of 0.91%).
| Demographics | Rating | Rank | Unemployment Among Ages 45 to 54 years |
| Nepalese | 0.0 /100 | #279 | Tragic 5.0% |
| Blackfeet | 0.0 /100 | #280 | Tragic 5.1% |
| Spanish American Indians | 0.0 /100 | #281 | Tragic 5.1% |
| Africans | 0.0 /100 | #282 | Tragic 5.1% |
| Hispanics or Latinos | 0.0 /100 | #283 | Tragic 5.1% |
| Kiowa | 0.0 /100 | #284 | Tragic 5.1% |
| Iroquois | 0.0 /100 | #285 | Tragic 5.1% |
| Senegalese | 0.0 /100 | #286 | Tragic 5.1% |
| Haitians | 0.0 /100 | #287 | Tragic 5.2% |
| Immigrants | Caribbean | 0.0 /100 | #288 | Tragic 5.2% |
| Immigrants | Haiti | 0.0 /100 | #289 | Tragic 5.2% |
| Immigrants | Portugal | 0.0 /100 | #290 | Tragic 5.2% |
| Armenians | 0.0 /100 | #291 | Tragic 5.2% |
| Trinidadians and Tobagonians | 0.0 /100 | #292 | Tragic 5.2% |
| Immigrants | Senegal | 0.0 /100 | #293 | Tragic 5.2% |
Demographics Similar to Immigrants from Switzerland by Unemployment Among Ages 45 to 54 years
In terms of unemployment among ages 45 to 54 years, the demographic groups most similar to Immigrants from Switzerland are Arab (4.6%, a difference of 0.030%), Immigrants from Africa (4.6%, a difference of 0.050%), Immigrants from Nigeria (4.6%, a difference of 0.070%), Immigrants from South America (4.6%, a difference of 0.18%), and Immigrants from Greece (4.6%, a difference of 0.20%).
| Demographics | Rating | Rank | Unemployment Among Ages 45 to 54 years |
| Brazilians | 20.1 /100 | #199 | Fair 4.6% |
| Immigrants | Denmark | 19.8 /100 | #200 | Poor 4.6% |
| Immigrants | Costa Rica | 19.7 /100 | #201 | Poor 4.6% |
| Immigrants | Peru | 19.1 /100 | #202 | Poor 4.6% |
| Liberians | 18.7 /100 | #203 | Poor 4.6% |
| Immigrants | Morocco | 16.8 /100 | #204 | Poor 4.6% |
| Immigrants | Greece | 16.2 /100 | #205 | Poor 4.6% |
| Immigrants | Switzerland | 14.0 /100 | #206 | Poor 4.6% |
| Arabs | 13.7 /100 | #207 | Poor 4.6% |
| Immigrants | Africa | 13.6 /100 | #208 | Poor 4.6% |
| Immigrants | Nigeria | 13.3 /100 | #209 | Poor 4.6% |
| Immigrants | South America | 12.2 /100 | #210 | Poor 4.6% |
| Creek | 11.9 /100 | #211 | Poor 4.6% |
| Immigrants | Iran | 11.5 /100 | #212 | Poor 4.6% |
| Panamanians | 10.7 /100 | #213 | Poor 4.6% |