Senegalese vs Immigrants from Sri Lanka Divorced or Separated
COMPARE
Senegalese
Immigrants from Sri Lanka
Divorced or Separated
Divorced or Separated Comparison
Senegalese
Immigrants from Sri Lanka
12.6%
DIVORCED OR SEPARATED
0.8/ 100
METRIC RATING
254th/ 347
METRIC RANK
10.8%
DIVORCED OR SEPARATED
100.0/ 100
METRIC RATING
24th/ 347
METRIC RANK
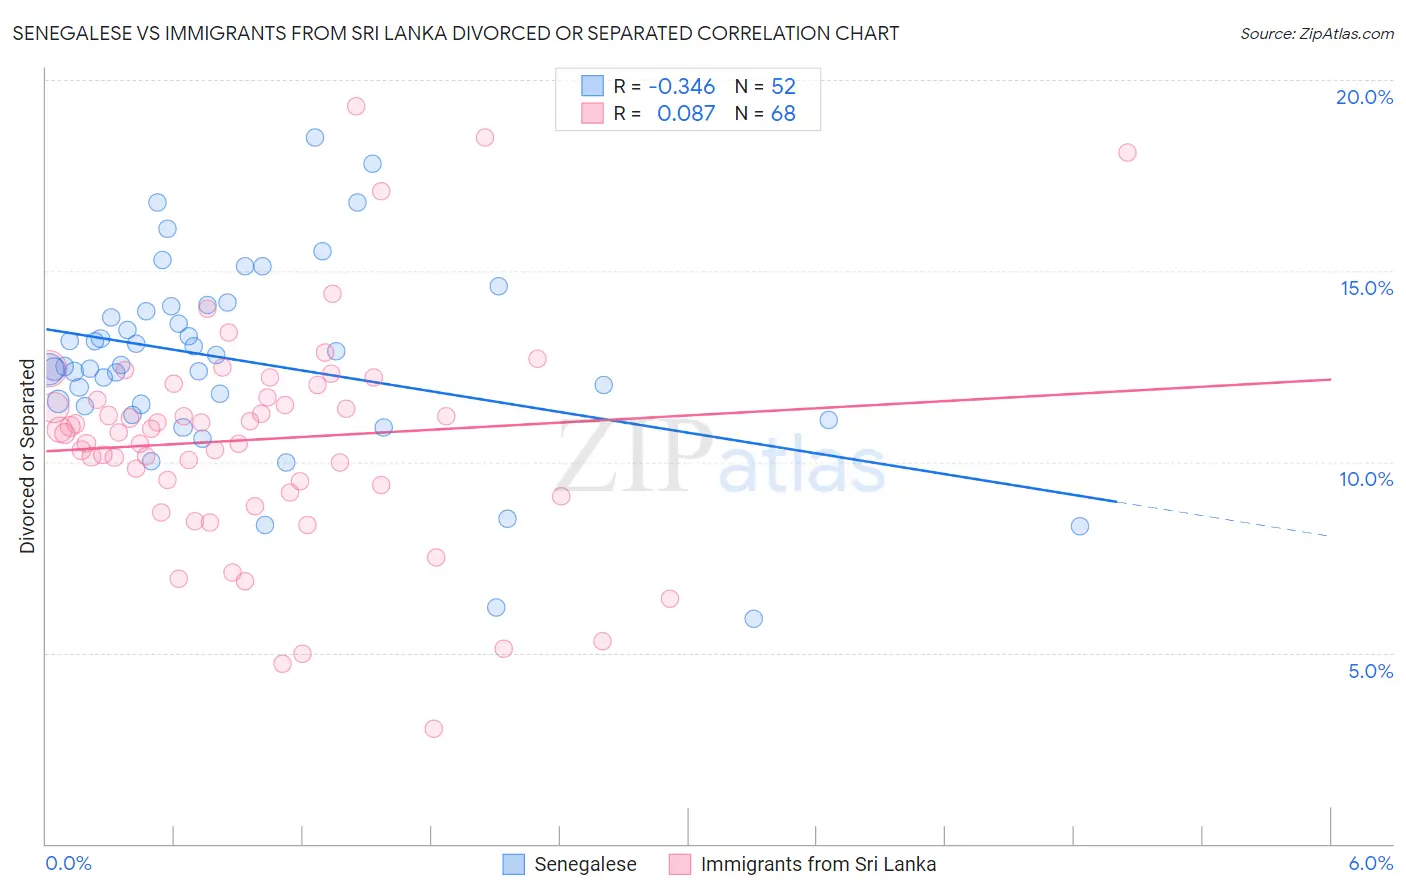
Senegalese vs Immigrants from Sri Lanka Divorced or Separated Correlation Chart
The statistical analysis conducted on geographies consisting of 78,107,305 people shows a mild negative correlation between the proportion of Senegalese and percentage of population currently divorced or separated in the United States with a correlation coefficient (R) of -0.346 and weighted average of 12.6%. Similarly, the statistical analysis conducted on geographies consisting of 149,682,065 people shows a slight positive correlation between the proportion of Immigrants from Sri Lanka and percentage of population currently divorced or separated in the United States with a correlation coefficient (R) of 0.087 and weighted average of 10.8%, a difference of 16.3%.
Divorced or Separated Correlation Summary
| Measurement | Senegalese | Immigrants from Sri Lanka |
| Minimum | 5.9% | 3.0% |
| Maximum | 18.5% | 19.3% |
| Range | 12.6% | 16.3% |
| Mean | 12.6% | 10.6% |
| Median | 12.5% | 10.8% |
| Interquartile 25% (IQ1) | 11.5% | 9.3% |
| Interquartile 75% (IQ3) | 14.0% | 11.8% |
| Interquartile Range (IQR) | 2.5% | 2.5% |
| Standard Deviation (Sample) | 2.5% | 3.0% |
| Standard Deviation (Population) | 2.5% | 2.9% |
Similar Demographics by Divorced or Separated
Demographics Similar to Senegalese by Divorced or Separated
In terms of divorced or separated, the demographic groups most similar to Senegalese are Liberian (12.6%, a difference of 0.060%), Somali (12.6%, a difference of 0.060%), Welsh (12.6%, a difference of 0.10%), Immigrants from Colombia (12.6%, a difference of 0.26%), and Immigrants from Somalia (12.6%, a difference of 0.27%).
| Demographics | Rating | Rank | Divorced or Separated |
| Germans | 1.8 /100 | #247 | Tragic 12.5% |
| Nepalese | 1.8 /100 | #248 | Tragic 12.5% |
| Finns | 1.8 /100 | #249 | Tragic 12.5% |
| Irish | 1.3 /100 | #250 | Tragic 12.5% |
| Aleuts | 1.3 /100 | #251 | Tragic 12.5% |
| Liberians | 0.9 /100 | #252 | Tragic 12.6% |
| Somalis | 0.9 /100 | #253 | Tragic 12.6% |
| Senegalese | 0.8 /100 | #254 | Tragic 12.6% |
| Welsh | 0.7 /100 | #255 | Tragic 12.6% |
| Immigrants | Colombia | 0.6 /100 | #256 | Tragic 12.6% |
| Immigrants | Somalia | 0.6 /100 | #257 | Tragic 12.6% |
| Indonesians | 0.6 /100 | #258 | Tragic 12.6% |
| Yuman | 0.6 /100 | #259 | Tragic 12.6% |
| Immigrants | Uruguay | 0.6 /100 | #260 | Tragic 12.6% |
| Immigrants | Dominica | 0.5 /100 | #261 | Tragic 12.6% |
Demographics Similar to Immigrants from Sri Lanka by Divorced or Separated
In terms of divorced or separated, the demographic groups most similar to Immigrants from Sri Lanka are Iranian (10.8%, a difference of 0.050%), Immigrants from Pakistan (10.8%, a difference of 0.19%), Vietnamese (10.8%, a difference of 0.37%), Immigrants from Asia (10.7%, a difference of 0.63%), and Burmese (10.7%, a difference of 0.81%).
| Demographics | Rating | Rank | Divorced or Separated |
| Immigrants | Israel | 100.0 /100 | #17 | Exceptional 10.6% |
| Immigrants | Iran | 100.0 /100 | #18 | Exceptional 10.6% |
| Asians | 100.0 /100 | #19 | Exceptional 10.6% |
| Burmese | 100.0 /100 | #20 | Exceptional 10.7% |
| Immigrants | Asia | 100.0 /100 | #21 | Exceptional 10.7% |
| Vietnamese | 100.0 /100 | #22 | Exceptional 10.8% |
| Immigrants | Pakistan | 100.0 /100 | #23 | Exceptional 10.8% |
| Immigrants | Sri Lanka | 100.0 /100 | #24 | Exceptional 10.8% |
| Iranians | 100.0 /100 | #25 | Exceptional 10.8% |
| Immigrants | Indonesia | 100.0 /100 | #26 | Exceptional 10.9% |
| Immigrants | Bangladesh | 100.0 /100 | #27 | Exceptional 11.0% |
| Immigrants | Malaysia | 100.0 /100 | #28 | Exceptional 11.0% |
| Armenians | 100.0 /100 | #29 | Exceptional 11.0% |
| Immigrants | Ireland | 100.0 /100 | #30 | Exceptional 11.0% |
| Mongolians | 100.0 /100 | #31 | Exceptional 11.1% |