Senegalese vs Immigrants from Denmark Family Households with Children
COMPARE
Senegalese
Immigrants from Denmark
Family Households with Children
Family Households with Children Comparison
Senegalese
Immigrants from Denmark
26.6%
FAMILY HOUSEHOLDS WITH CHILDREN
0.4/ 100
METRIC RATING
280th/ 347
METRIC RANK
26.7%
FAMILY HOUSEHOLDS WITH CHILDREN
0.8/ 100
METRIC RATING
269th/ 347
METRIC RANK
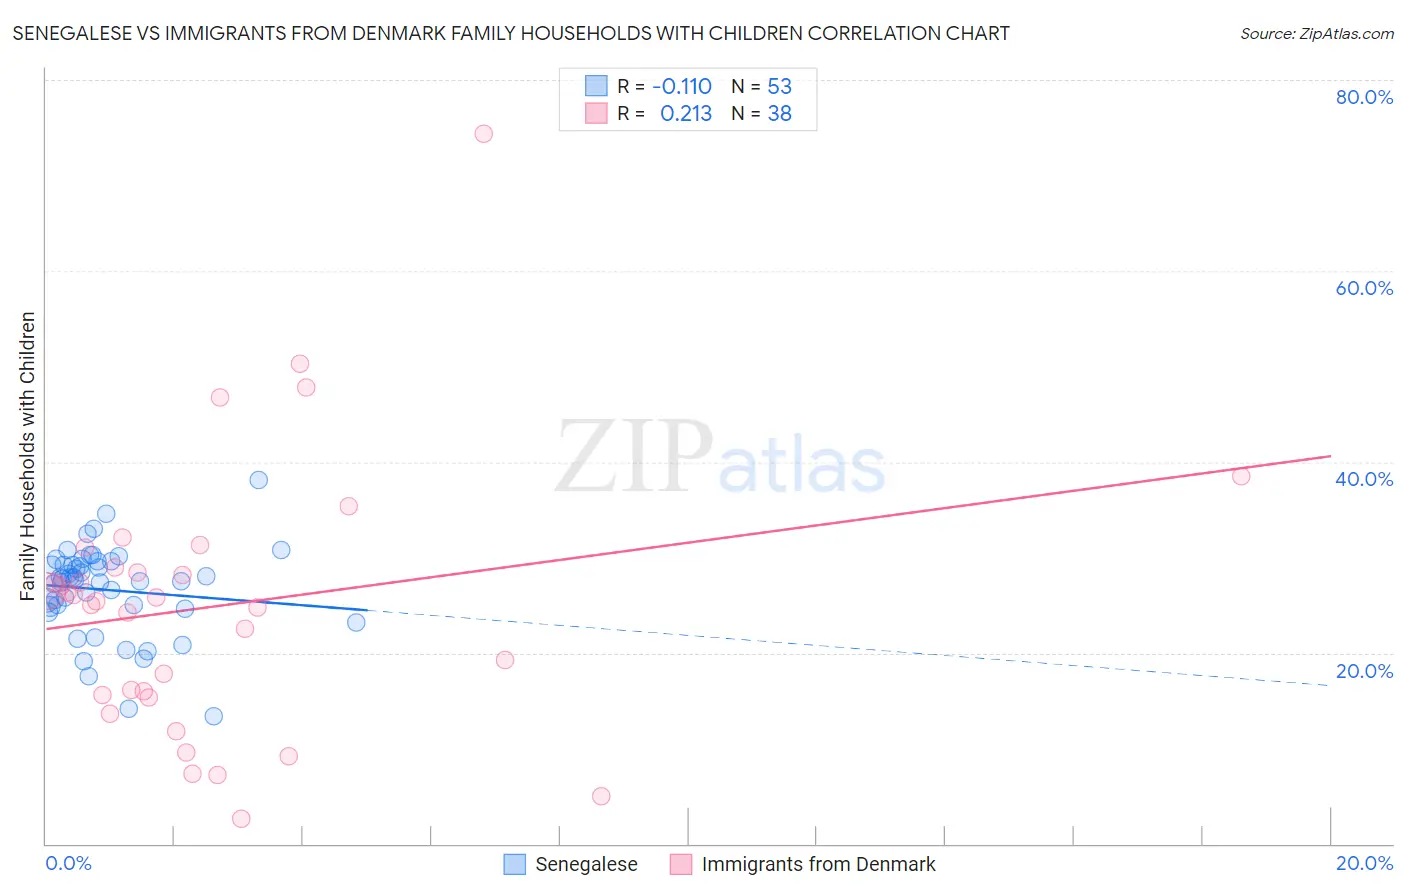
Senegalese vs Immigrants from Denmark Family Households with Children Correlation Chart
The statistical analysis conducted on geographies consisting of 78,103,218 people shows a poor negative correlation between the proportion of Senegalese and percentage of family households with children in the United States with a correlation coefficient (R) of -0.110 and weighted average of 26.6%. Similarly, the statistical analysis conducted on geographies consisting of 136,396,181 people shows a weak positive correlation between the proportion of Immigrants from Denmark and percentage of family households with children in the United States with a correlation coefficient (R) of 0.213 and weighted average of 26.7%, a difference of 0.46%.
Family Households with Children Correlation Summary
| Measurement | Senegalese | Immigrants from Denmark |
| Minimum | 13.3% | 2.6% |
| Maximum | 38.1% | 74.3% |
| Range | 24.8% | 71.7% |
| Mean | 26.6% | 24.9% |
| Median | 27.7% | 25.6% |
| Interquartile 25% (IQ1) | 24.7% | 15.6% |
| Interquartile 75% (IQ3) | 29.4% | 28.9% |
| Interquartile Range (IQR) | 4.7% | 13.3% |
| Standard Deviation (Sample) | 4.7% | 14.0% |
| Standard Deviation (Population) | 4.7% | 13.9% |
Demographics Similar to Senegalese and Immigrants from Denmark by Family Households with Children
In terms of family households with children, the demographic groups most similar to Senegalese are Finnish (26.6%, a difference of 0.020%), Immigrants from Europe (26.6%, a difference of 0.050%), Lithuanian (26.6%, a difference of 0.090%), Celtic (26.6%, a difference of 0.10%), and French American Indian (26.6%, a difference of 0.11%). Similarly, the demographic groups most similar to Immigrants from Denmark are Immigrants from Belgium (26.7%, a difference of 0.040%), Immigrants from Uzbekistan (26.7%, a difference of 0.050%), Immigrants from Zaire (26.7%, a difference of 0.050%), Chippewa (26.7%, a difference of 0.060%), and Maltese (26.7%, a difference of 0.060%).
| Demographics | Rating | Rank | Family Households with Children |
| Taiwanese | 0.9 /100 | #264 | Tragic 26.7% |
| Chippewa | 0.9 /100 | #265 | Tragic 26.7% |
| Maltese | 0.9 /100 | #266 | Tragic 26.7% |
| Immigrants | Uzbekistan | 0.9 /100 | #267 | Tragic 26.7% |
| Immigrants | Belgium | 0.9 /100 | #268 | Tragic 26.7% |
| Immigrants | Denmark | 0.8 /100 | #269 | Tragic 26.7% |
| Immigrants | Zaire | 0.7 /100 | #270 | Tragic 26.7% |
| French | 0.7 /100 | #271 | Tragic 26.7% |
| Somalis | 0.7 /100 | #272 | Tragic 26.7% |
| Immigrants | Hungary | 0.6 /100 | #273 | Tragic 26.7% |
| Eastern Europeans | 0.6 /100 | #274 | Tragic 26.7% |
| Immigrants | Northern Europe | 0.5 /100 | #275 | Tragic 26.7% |
| Immigrants | Spain | 0.5 /100 | #276 | Tragic 26.6% |
| Celtics | 0.4 /100 | #277 | Tragic 26.6% |
| Immigrants | Europe | 0.4 /100 | #278 | Tragic 26.6% |
| Finns | 0.4 /100 | #279 | Tragic 26.6% |
| Senegalese | 0.4 /100 | #280 | Tragic 26.6% |
| Lithuanians | 0.3 /100 | #281 | Tragic 26.6% |
| French American Indians | 0.3 /100 | #282 | Tragic 26.6% |
| Immigrants | North America | 0.3 /100 | #283 | Tragic 26.6% |
| Immigrants | Canada | 0.3 /100 | #284 | Tragic 26.5% |