Senegalese vs Immigrants from Denmark Bachelor's Degree
COMPARE
Senegalese
Immigrants from Denmark
Bachelor's Degree
Bachelor's Degree Comparison
Senegalese
Immigrants from Denmark
37.5%
BACHELOR'S DEGREE
42.2/ 100
METRIC RATING
183rd/ 347
METRIC RANK
45.4%
BACHELOR'S DEGREE
100.0/ 100
METRIC RATING
34th/ 347
METRIC RANK
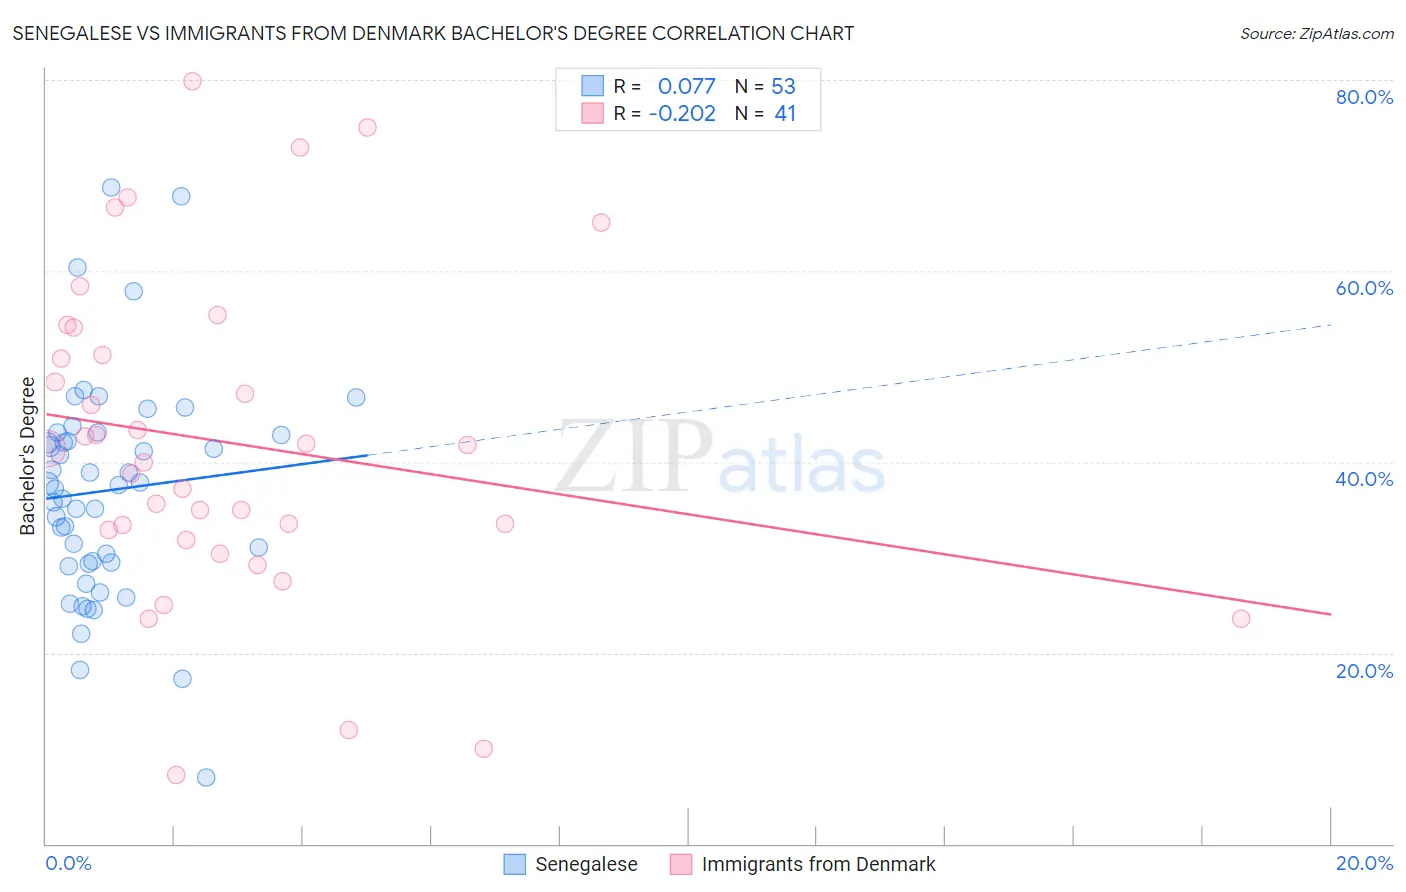
Senegalese vs Immigrants from Denmark Bachelor's Degree Correlation Chart
The statistical analysis conducted on geographies consisting of 78,136,633 people shows a slight positive correlation between the proportion of Senegalese and percentage of population with at least bachelor's degree education in the United States with a correlation coefficient (R) of 0.077 and weighted average of 37.5%. Similarly, the statistical analysis conducted on geographies consisting of 136,428,731 people shows a weak negative correlation between the proportion of Immigrants from Denmark and percentage of population with at least bachelor's degree education in the United States with a correlation coefficient (R) of -0.202 and weighted average of 45.4%, a difference of 21.0%.
Bachelor's Degree Correlation Summary
| Measurement | Senegalese | Immigrants from Denmark |
| Minimum | 6.9% | 7.2% |
| Maximum | 68.8% | 79.9% |
| Range | 61.9% | 72.7% |
| Mean | 37.0% | 42.0% |
| Median | 37.6% | 41.3% |
| Interquartile 25% (IQ1) | 29.4% | 32.3% |
| Interquartile 75% (IQ3) | 42.9% | 52.7% |
| Interquartile Range (IQR) | 13.5% | 20.3% |
| Standard Deviation (Sample) | 11.6% | 16.9% |
| Standard Deviation (Population) | 11.5% | 16.7% |
Similar Demographics by Bachelor's Degree
Demographics Similar to Senegalese by Bachelor's Degree
In terms of bachelor's degree, the demographic groups most similar to Senegalese are Scandinavian (37.5%, a difference of 0.040%), Immigrants from Peru (37.5%, a difference of 0.080%), Immigrants from Bosnia and Herzegovina (37.6%, a difference of 0.13%), Immigrants from Senegal (37.6%, a difference of 0.16%), and Norwegian (37.5%, a difference of 0.18%).
| Demographics | Rating | Rank | Bachelor's Degree |
| Costa Ricans | 47.6 /100 | #176 | Average 37.7% |
| Basques | 47.4 /100 | #177 | Average 37.7% |
| Immigrants | Cameroon | 46.8 /100 | #178 | Average 37.7% |
| Immigrants | Colombia | 45.4 /100 | #179 | Average 37.7% |
| Irish | 44.3 /100 | #180 | Average 37.6% |
| Immigrants | Senegal | 43.8 /100 | #181 | Average 37.6% |
| Immigrants | Bosnia and Herzegovina | 43.4 /100 | #182 | Average 37.6% |
| Senegalese | 42.2 /100 | #183 | Average 37.5% |
| Scandinavians | 41.7 /100 | #184 | Average 37.5% |
| Immigrants | Peru | 41.3 /100 | #185 | Average 37.5% |
| Norwegians | 40.4 /100 | #186 | Average 37.5% |
| English | 39.7 /100 | #187 | Fair 37.4% |
| Immigrants | Oceania | 37.3 /100 | #188 | Fair 37.3% |
| Slovaks | 36.9 /100 | #189 | Fair 37.3% |
| Swiss | 34.1 /100 | #190 | Fair 37.2% |
Demographics Similar to Immigrants from Denmark by Bachelor's Degree
In terms of bachelor's degree, the demographic groups most similar to Immigrants from Denmark are Immigrants from Russia (45.4%, a difference of 0.030%), Mongolian (45.4%, a difference of 0.040%), Russian (45.3%, a difference of 0.19%), Bulgarian (45.3%, a difference of 0.28%), and Immigrants from Northern Europe (45.6%, a difference of 0.45%).
| Demographics | Rating | Rank | Bachelor's Degree |
| Immigrants | France | 100.0 /100 | #27 | Exceptional 46.4% |
| Turks | 100.0 /100 | #28 | Exceptional 46.2% |
| Israelis | 100.0 /100 | #29 | Exceptional 46.1% |
| Immigrants | Sri Lanka | 100.0 /100 | #30 | Exceptional 46.1% |
| Latvians | 100.0 /100 | #31 | Exceptional 46.1% |
| Immigrants | Turkey | 100.0 /100 | #32 | Exceptional 46.0% |
| Immigrants | Northern Europe | 100.0 /100 | #33 | Exceptional 45.6% |
| Immigrants | Denmark | 100.0 /100 | #34 | Exceptional 45.4% |
| Immigrants | Russia | 100.0 /100 | #35 | Exceptional 45.4% |
| Mongolians | 100.0 /100 | #36 | Exceptional 45.4% |
| Russians | 100.0 /100 | #37 | Exceptional 45.3% |
| Bulgarians | 100.0 /100 | #38 | Exceptional 45.3% |
| Immigrants | Latvia | 100.0 /100 | #39 | Exceptional 45.1% |
| Immigrants | Belarus | 100.0 /100 | #40 | Exceptional 45.0% |
| Immigrants | Malaysia | 100.0 /100 | #41 | Exceptional 45.0% |