Senegalese vs Immigrants from Syria Divorced or Separated
COMPARE
Senegalese
Immigrants from Syria
Divorced or Separated
Divorced or Separated Comparison
Senegalese
Immigrants from Syria
12.6%
DIVORCED OR SEPARATED
0.8/ 100
METRIC RATING
254th/ 347
METRIC RANK
11.4%
DIVORCED OR SEPARATED
99.7/ 100
METRIC RATING
67th/ 347
METRIC RANK
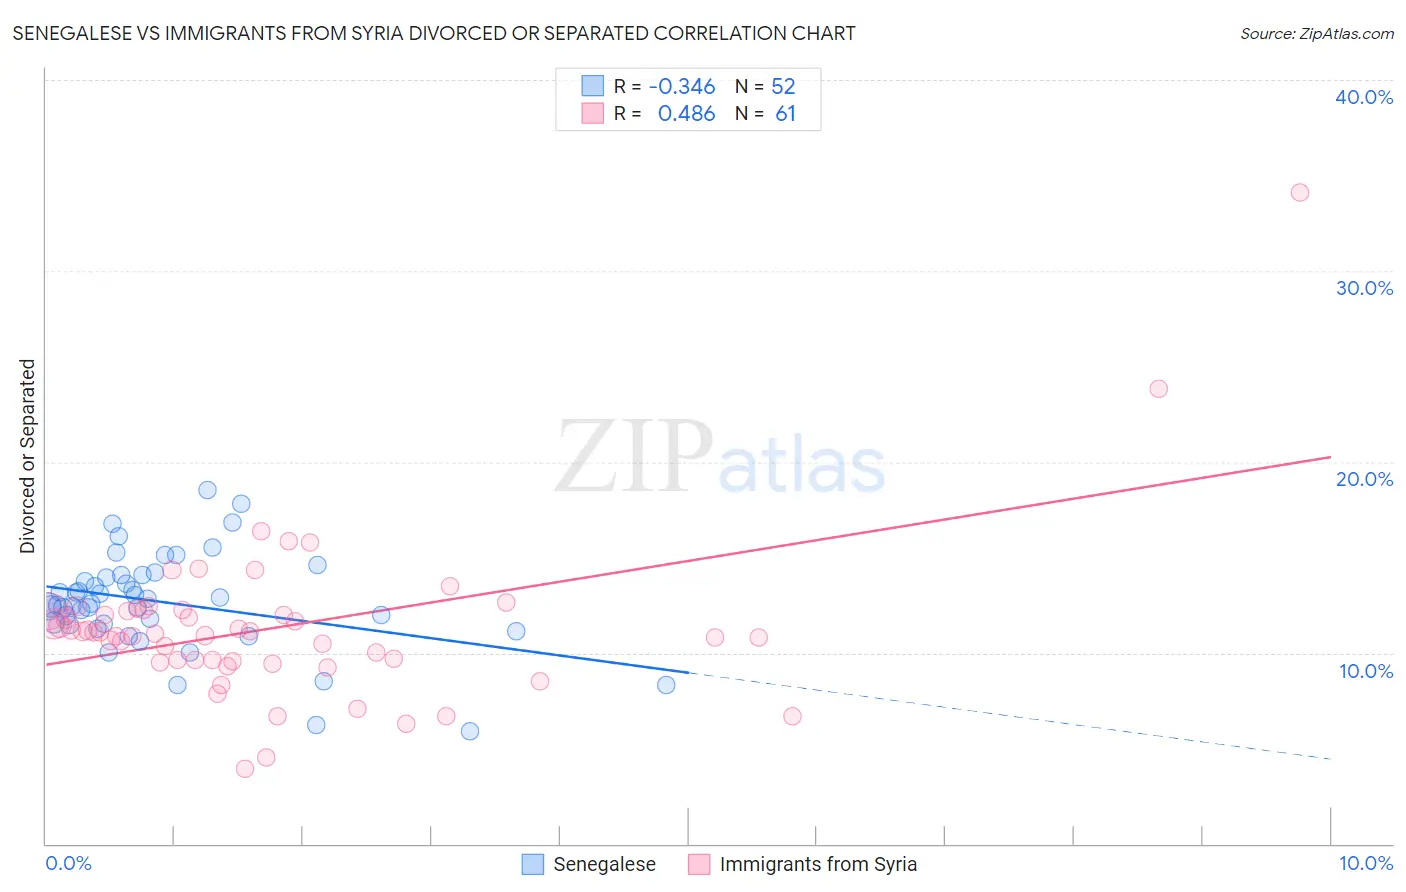
Senegalese vs Immigrants from Syria Divorced or Separated Correlation Chart
The statistical analysis conducted on geographies consisting of 78,107,305 people shows a mild negative correlation between the proportion of Senegalese and percentage of population currently divorced or separated in the United States with a correlation coefficient (R) of -0.346 and weighted average of 12.6%. Similarly, the statistical analysis conducted on geographies consisting of 174,113,022 people shows a moderate positive correlation between the proportion of Immigrants from Syria and percentage of population currently divorced or separated in the United States with a correlation coefficient (R) of 0.486 and weighted average of 11.4%, a difference of 9.8%.
Divorced or Separated Correlation Summary
| Measurement | Senegalese | Immigrants from Syria |
| Minimum | 5.9% | 3.9% |
| Maximum | 18.5% | 34.1% |
| Range | 12.6% | 30.2% |
| Mean | 12.6% | 11.3% |
| Median | 12.5% | 11.1% |
| Interquartile 25% (IQ1) | 11.5% | 9.6% |
| Interquartile 75% (IQ3) | 14.0% | 12.2% |
| Interquartile Range (IQR) | 2.5% | 2.6% |
| Standard Deviation (Sample) | 2.5% | 4.2% |
| Standard Deviation (Population) | 2.5% | 4.2% |
Similar Demographics by Divorced or Separated
Demographics Similar to Senegalese by Divorced or Separated
In terms of divorced or separated, the demographic groups most similar to Senegalese are Liberian (12.6%, a difference of 0.060%), Somali (12.6%, a difference of 0.060%), Welsh (12.6%, a difference of 0.10%), Immigrants from Colombia (12.6%, a difference of 0.26%), and Immigrants from Somalia (12.6%, a difference of 0.27%).
| Demographics | Rating | Rank | Divorced or Separated |
| Germans | 1.8 /100 | #247 | Tragic 12.5% |
| Nepalese | 1.8 /100 | #248 | Tragic 12.5% |
| Finns | 1.8 /100 | #249 | Tragic 12.5% |
| Irish | 1.3 /100 | #250 | Tragic 12.5% |
| Aleuts | 1.3 /100 | #251 | Tragic 12.5% |
| Liberians | 0.9 /100 | #252 | Tragic 12.6% |
| Somalis | 0.9 /100 | #253 | Tragic 12.6% |
| Senegalese | 0.8 /100 | #254 | Tragic 12.6% |
| Welsh | 0.7 /100 | #255 | Tragic 12.6% |
| Immigrants | Colombia | 0.6 /100 | #256 | Tragic 12.6% |
| Immigrants | Somalia | 0.6 /100 | #257 | Tragic 12.6% |
| Indonesians | 0.6 /100 | #258 | Tragic 12.6% |
| Yuman | 0.6 /100 | #259 | Tragic 12.6% |
| Immigrants | Uruguay | 0.6 /100 | #260 | Tragic 12.6% |
| Immigrants | Dominica | 0.5 /100 | #261 | Tragic 12.6% |
Demographics Similar to Immigrants from Syria by Divorced or Separated
In terms of divorced or separated, the demographic groups most similar to Immigrants from Syria are Inupiat (11.4%, a difference of 0.090%), Palestinian (11.5%, a difference of 0.11%), Immigrants from Belgium (11.5%, a difference of 0.11%), Immigrants from Eastern Europe (11.5%, a difference of 0.13%), and Immigrants from South Eastern Asia (11.4%, a difference of 0.23%).
| Demographics | Rating | Rank | Divorced or Separated |
| Immigrants | Russia | 99.9 /100 | #60 | Exceptional 11.3% |
| Koreans | 99.9 /100 | #61 | Exceptional 11.3% |
| Luxembourgers | 99.9 /100 | #62 | Exceptional 11.3% |
| Immigrants | Kuwait | 99.9 /100 | #63 | Exceptional 11.3% |
| Macedonians | 99.8 /100 | #64 | Exceptional 11.4% |
| Immigrants | South Eastern Asia | 99.8 /100 | #65 | Exceptional 11.4% |
| Inupiat | 99.8 /100 | #66 | Exceptional 11.4% |
| Immigrants | Syria | 99.7 /100 | #67 | Exceptional 11.4% |
| Palestinians | 99.7 /100 | #68 | Exceptional 11.5% |
| Immigrants | Belgium | 99.7 /100 | #69 | Exceptional 11.5% |
| Immigrants | Eastern Europe | 99.7 /100 | #70 | Exceptional 11.5% |
| Paraguayans | 99.7 /100 | #71 | Exceptional 11.5% |
| Jordanians | 99.6 /100 | #72 | Exceptional 11.5% |
| Immigrants | North Macedonia | 99.6 /100 | #73 | Exceptional 11.5% |
| Taiwanese | 99.6 /100 | #74 | Exceptional 11.5% |