Seminole vs Trinidadian and Tobagonian Divorced or Separated
COMPARE
Seminole
Trinidadian and Tobagonian
Divorced or Separated
Divorced or Separated Comparison
Seminole
Trinidadians and Tobagonians
14.3%
DIVORCED OR SEPARATED
0.0/ 100
METRIC RATING
342nd/ 347
METRIC RANK
12.2%
DIVORCED OR SEPARATED
16.6/ 100
METRIC RATING
211th/ 347
METRIC RANK
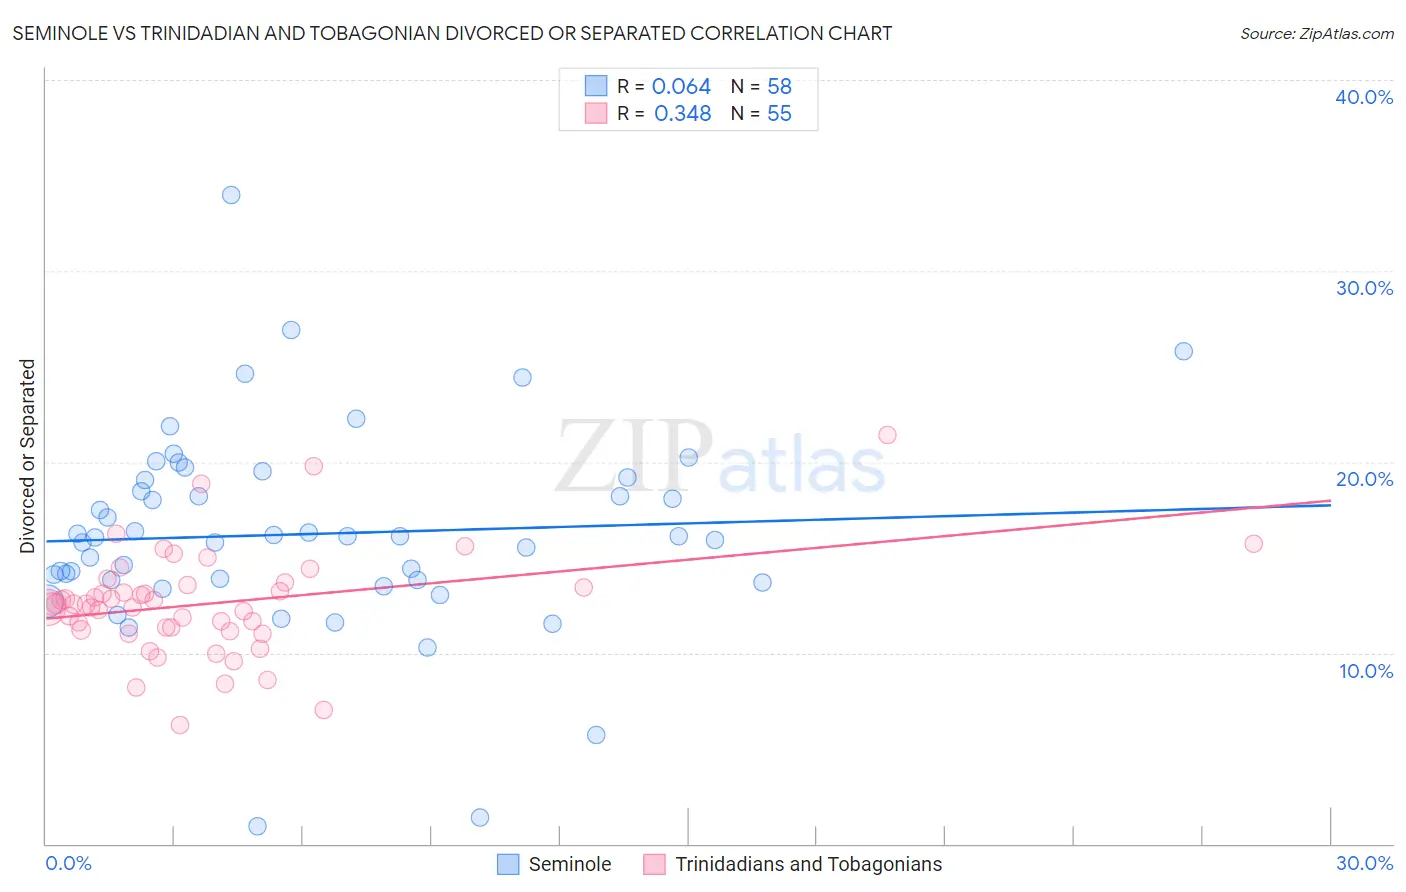
Seminole vs Trinidadian and Tobagonian Divorced or Separated Correlation Chart
The statistical analysis conducted on geographies consisting of 118,302,792 people shows a slight positive correlation between the proportion of Seminole and percentage of population currently divorced or separated in the United States with a correlation coefficient (R) of 0.064 and weighted average of 14.3%. Similarly, the statistical analysis conducted on geographies consisting of 219,763,096 people shows a mild positive correlation between the proportion of Trinidadians and Tobagonians and percentage of population currently divorced or separated in the United States with a correlation coefficient (R) of 0.348 and weighted average of 12.2%, a difference of 16.6%.
Divorced or Separated Correlation Summary
| Measurement | Seminole | Trinidadian and Tobagonian |
| Minimum | 0.90% | 6.2% |
| Maximum | 34.0% | 21.4% |
| Range | 33.1% | 15.2% |
| Mean | 16.2% | 12.6% |
| Median | 16.1% | 12.5% |
| Interquartile 25% (IQ1) | 13.8% | 11.2% |
| Interquartile 75% (IQ3) | 19.0% | 13.5% |
| Interquartile Range (IQR) | 5.2% | 2.3% |
| Standard Deviation (Sample) | 5.4% | 2.8% |
| Standard Deviation (Population) | 5.3% | 2.7% |
Similar Demographics by Divorced or Separated
Demographics Similar to Seminole by Divorced or Separated
In terms of divorced or separated, the demographic groups most similar to Seminole are Bahamian (14.2%, a difference of 0.17%), Chickasaw (14.2%, a difference of 0.36%), Colville (14.2%, a difference of 0.40%), Choctaw (14.1%, a difference of 0.93%), and Creek (14.4%, a difference of 1.1%).
| Demographics | Rating | Rank | Divorced or Separated |
| Puerto Ricans | 0.0 /100 | #333 | Tragic 13.9% |
| Immigrants | Bahamas | 0.0 /100 | #334 | Tragic 13.9% |
| Dutch West Indians | 0.0 /100 | #335 | Tragic 14.0% |
| Shoshone | 0.0 /100 | #336 | Tragic 14.0% |
| Crow | 0.0 /100 | #337 | Tragic 14.1% |
| Choctaw | 0.0 /100 | #338 | Tragic 14.1% |
| Colville | 0.0 /100 | #339 | Tragic 14.2% |
| Chickasaw | 0.0 /100 | #340 | Tragic 14.2% |
| Bahamians | 0.0 /100 | #341 | Tragic 14.2% |
| Seminole | 0.0 /100 | #342 | Tragic 14.3% |
| Creek | 0.0 /100 | #343 | Tragic 14.4% |
| Cubans | 0.0 /100 | #344 | Tragic 14.5% |
| Kiowa | 0.0 /100 | #345 | Tragic 14.5% |
| Arapaho | 0.0 /100 | #346 | Tragic 14.8% |
| Immigrants | Cuba | 0.0 /100 | #347 | Tragic 15.2% |
Demographics Similar to Trinidadians and Tobagonians by Divorced or Separated
In terms of divorced or separated, the demographic groups most similar to Trinidadians and Tobagonians are Immigrants from Kenya (12.2%, a difference of 0.010%), Slavic (12.2%, a difference of 0.020%), Immigrants from Eastern Africa (12.2%, a difference of 0.030%), Immigrants from Trinidad and Tobago (12.2%, a difference of 0.070%), and Immigrants from Argentina (12.2%, a difference of 0.070%).
| Demographics | Rating | Rank | Divorced or Separated |
| Kenyans | 21.8 /100 | #204 | Fair 12.2% |
| Immigrants | Costa Rica | 21.3 /100 | #205 | Fair 12.2% |
| Slovaks | 21.0 /100 | #206 | Fair 12.2% |
| Mexicans | 21.0 /100 | #207 | Fair 12.2% |
| Immigrants | Ghana | 18.8 /100 | #208 | Poor 12.2% |
| Immigrants | Trinidad and Tobago | 17.8 /100 | #209 | Poor 12.2% |
| Slavs | 17.0 /100 | #210 | Poor 12.2% |
| Trinidadians and Tobagonians | 16.6 /100 | #211 | Poor 12.2% |
| Immigrants | Kenya | 16.5 /100 | #212 | Poor 12.2% |
| Immigrants | Eastern Africa | 16.2 /100 | #213 | Poor 12.2% |
| Immigrants | Argentina | 15.5 /100 | #214 | Poor 12.2% |
| Europeans | 15.4 /100 | #215 | Poor 12.2% |
| Immigrants | South America | 15.4 /100 | #216 | Poor 12.2% |
| Northern Europeans | 14.7 /100 | #217 | Poor 12.2% |
| Slovenes | 13.2 /100 | #218 | Poor 12.3% |