Seminole vs Immigrants from Russia Currently Married
COMPARE
Seminole
Immigrants from Russia
Currently Married
Currently Married Comparison
Seminole
Immigrants from Russia
44.6%
CURRENTLY MARRIED
0.9/ 100
METRIC RATING
237th/ 347
METRIC RANK
47.7%
CURRENTLY MARRIED
92.0/ 100
METRIC RATING
110th/ 347
METRIC RANK
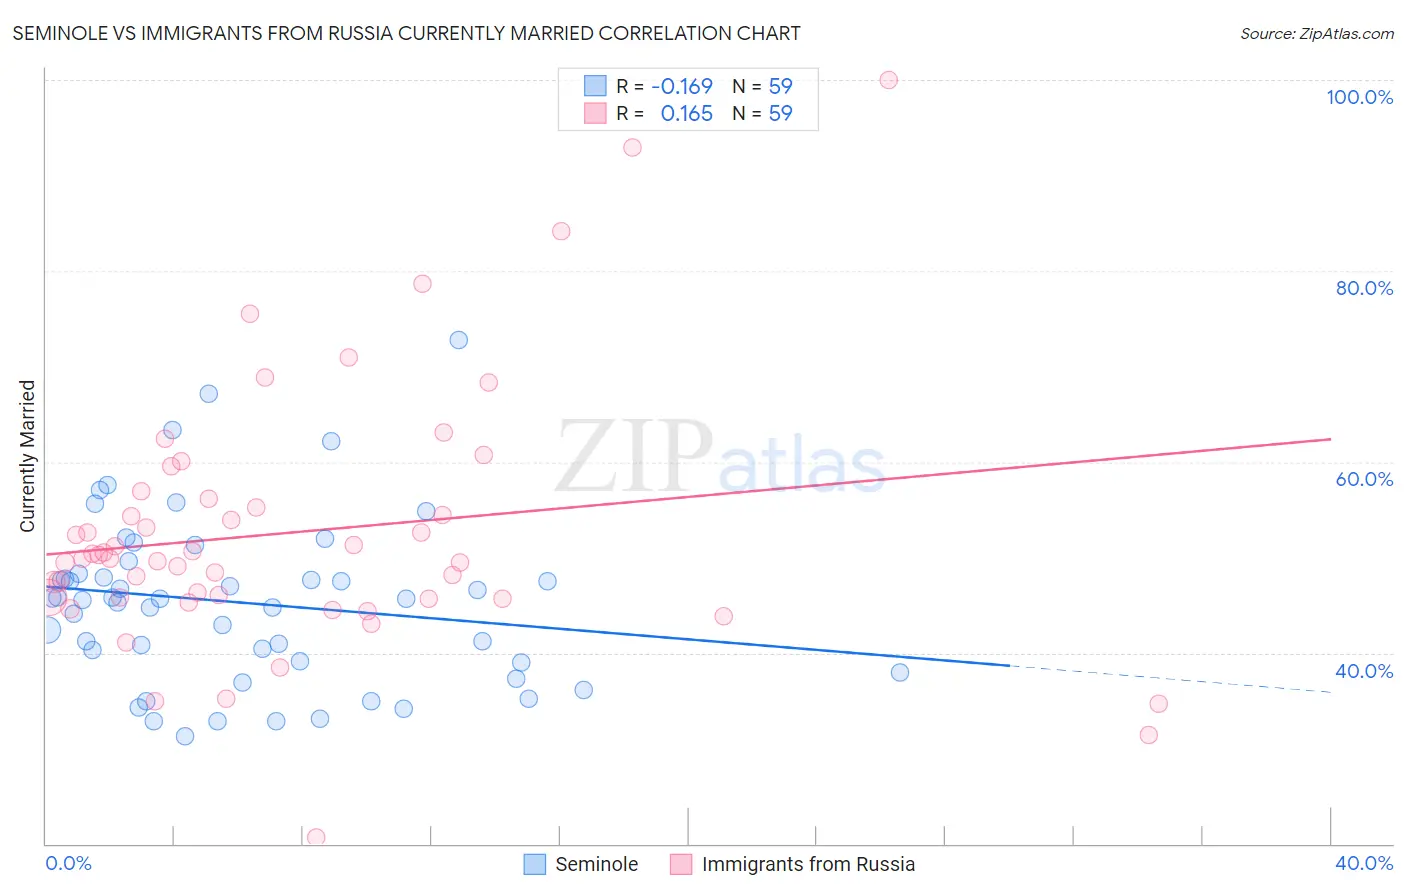
Seminole vs Immigrants from Russia Currently Married Correlation Chart
The statistical analysis conducted on geographies consisting of 118,313,136 people shows a poor negative correlation between the proportion of Seminole and percentage of population currently married in the United States with a correlation coefficient (R) of -0.169 and weighted average of 44.6%. Similarly, the statistical analysis conducted on geographies consisting of 347,902,051 people shows a poor positive correlation between the proportion of Immigrants from Russia and percentage of population currently married in the United States with a correlation coefficient (R) of 0.165 and weighted average of 47.7%, a difference of 6.8%.
Currently Married Correlation Summary
| Measurement | Seminole | Immigrants from Russia |
| Minimum | 31.2% | 20.6% |
| Maximum | 72.8% | 100.0% |
| Range | 41.6% | 79.4% |
| Mean | 45.3% | 52.6% |
| Median | 45.6% | 49.9% |
| Interquartile 25% (IQ1) | 39.0% | 45.6% |
| Interquartile 75% (IQ3) | 48.3% | 56.2% |
| Interquartile Range (IQR) | 9.3% | 10.6% |
| Standard Deviation (Sample) | 8.9% | 13.7% |
| Standard Deviation (Population) | 8.8% | 13.6% |
Similar Demographics by Currently Married
Demographics Similar to Seminole by Currently Married
In terms of currently married, the demographic groups most similar to Seminole are Cuban (44.6%, a difference of 0.0%), Alaskan Athabascan (44.6%, a difference of 0.010%), Moroccan (44.6%, a difference of 0.080%), Iroquois (44.7%, a difference of 0.17%), and Immigrants from Saudi Arabia (44.7%, a difference of 0.18%).
| Demographics | Rating | Rank | Currently Married |
| Immigrants | Kenya | 1.6 /100 | #230 | Tragic 44.9% |
| Immigrants | Panama | 1.5 /100 | #231 | Tragic 44.9% |
| Nepalese | 1.2 /100 | #232 | Tragic 44.7% |
| Immigrants | Saudi Arabia | 1.1 /100 | #233 | Tragic 44.7% |
| Iroquois | 1.1 /100 | #234 | Tragic 44.7% |
| Alaskan Athabascans | 0.9 /100 | #235 | Tragic 44.6% |
| Cubans | 0.9 /100 | #236 | Tragic 44.6% |
| Seminole | 0.9 /100 | #237 | Tragic 44.6% |
| Moroccans | 0.9 /100 | #238 | Tragic 44.6% |
| Immigrants | Mexico | 0.7 /100 | #239 | Tragic 44.5% |
| Mexican American Indians | 0.7 /100 | #240 | Tragic 44.5% |
| Ethiopians | 0.7 /100 | #241 | Tragic 44.5% |
| Immigrants | Cambodia | 0.7 /100 | #242 | Tragic 44.5% |
| Immigrants | Ethiopia | 0.7 /100 | #243 | Tragic 44.5% |
| Japanese | 0.6 /100 | #244 | Tragic 44.5% |
Demographics Similar to Immigrants from Russia by Currently Married
In terms of currently married, the demographic groups most similar to Immigrants from Russia are Immigrants from Egypt (47.7%, a difference of 0.040%), Tsimshian (47.7%, a difference of 0.050%), Immigrants from Hungary (47.6%, a difference of 0.090%), Immigrants from Western Europe (47.6%, a difference of 0.10%), and Immigrants from Italy (47.7%, a difference of 0.11%).
| Demographics | Rating | Rank | Currently Married |
| Cypriots | 93.7 /100 | #103 | Exceptional 47.8% |
| Serbians | 93.6 /100 | #104 | Exceptional 47.8% |
| Immigrants | Singapore | 93.3 /100 | #105 | Exceptional 47.8% |
| Immigrants | Greece | 93.1 /100 | #106 | Exceptional 47.7% |
| Immigrants | Italy | 92.9 /100 | #107 | Exceptional 47.7% |
| Tsimshian | 92.4 /100 | #108 | Exceptional 47.7% |
| Immigrants | Egypt | 92.3 /100 | #109 | Exceptional 47.7% |
| Immigrants | Russia | 92.0 /100 | #110 | Exceptional 47.7% |
| Immigrants | Hungary | 91.2 /100 | #111 | Exceptional 47.6% |
| Immigrants | Western Europe | 91.1 /100 | #112 | Exceptional 47.6% |
| Immigrants | Denmark | 90.9 /100 | #113 | Exceptional 47.6% |
| South Africans | 90.5 /100 | #114 | Exceptional 47.6% |
| Immigrants | Indonesia | 90.5 /100 | #115 | Exceptional 47.6% |
| Palestinians | 90.4 /100 | #116 | Exceptional 47.6% |
| Puget Sound Salish | 90.3 /100 | #117 | Exceptional 47.6% |