Seminole vs Ghanaian 7th Grade

COMPARE

Seminole
Race
Ancestry
AfghanAfricanAlaska NativeAlaskan AthabascanAlbanianAleutAlsatianAmericanApacheArabArapahoArgentineanArmenianAssyrian/Chaldean/SyriacAustralianAustrianBahamianBangladeshiBarbadianBasqueBelgianBelizeanBermudanBhutaneseBlackfeetBolivianBrazilianBritishBritish West IndianBulgarianBurmeseCajunCambodianCanadianCape VerdeanCarpatho RusynCelticCentral AmericanCentral American IndianCherokeeCheyenneChickasawChileanChineseChippewaChoctawColombianColvilleComancheCosta RicanCreeCreekCroatianCrowCubanCypriotCzechCzechoslovakianDanishDelawareDominicanDutchDutch West IndianEastern EuropeanEcuadorianEgyptianEnglishEstonianEthiopianEuropeanFijianFilipinoFinnishFrenchFrench American IndianFrench CanadianGermanGerman RussianGreekGuamanian/ChamorroGuatemalanGuyaneseHaitianHmongHonduranHopiHoumaHungarianIcelanderIndian (Asian)IndonesianInupiatIranianIraqiIrishIroquoisIsraeliItalianJamaicanJapaneseJordanianKenyanKiowaKoreanLaotianLatvianLebaneseLiberianLithuanianLumbeeLuxembourgerMacedonianMalaysianMalteseMarshalleseMenomineeMexicanMexican American IndianMongolianMoroccanNative HawaiianNavajoNepaleseNew ZealanderNicaraguanNigerianNorthern EuropeanNorwegianOkinawanOsageOttawaPaiutePakistaniPalestinianPanamanianParaguayanPennsylvania GermanPeruvianPimaPolishPortuguesePotawatomiPuebloPuerto RicanPuget Sound SalishRomanianRussianSalvadoranSamoanScandinavianScotch-IrishScottishSeminoleSenegaleseSerbianShoshoneSierra LeoneanSiouxSlavicSlovakSloveneSomaliSouth AfricanSouth AmericanSouth American IndianSoviet UnionSpaniardSpanishSpanish AmericanSpanish American IndianSri LankanSubsaharan AfricanSudaneseSwedishSwissSyrianTaiwaneseThaiTlingit-HaidaTohono O'OdhamTonganTrinidadian and TobagonianTsimshianTurkishU.S. Virgin IslanderUgandanUkrainianUruguayanUteVenezuelanVietnameseWelshWest IndianYakamaYaquiYugoslavianYumanYup'ikZimbabwean
Immigration
NonimmigrantsImmigrantsAfghanistanAfricaAlbaniaArgentinaArmeniaAsiaAustraliaAustriaBahamasBangladeshBarbadosBelarusBelgiumBelizeBoliviaBosnia and HerzegovinaBrazilBulgariaBurma/MyanmarCabo VerdeCambodiaCameroonCanadaCaribbeanCentral AmericaChileChinaColombiaCongoCosta RicaCroatiaCubaCzechoslovakiaDenmarkDominicaDominican RepublicEastern AfricaEastern AsiaEastern EuropeEcuadorEgyptEl SalvadorEnglandEritreaEthiopiaEuropeFijiFranceGermanyGhanaGreeceGrenadaGuatemalaGuyanaHaitiHondurasHong KongHungaryIndiaIndonesiaIranIraqIrelandIsraelItalyJamaicaJapanJordanKazakhstanKenyaKoreaKuwaitLaosLatin AmericaLatviaLebanonLiberiaLithuaniaMalaysiaMexicoMicronesiaMiddle AfricaMoldovaMoroccoNepalNetherlandsNicaraguaNigeriaNorth AmericaNorth MacedoniaNorthern AfricaNorthern EuropeNorwayOceaniaPakistanPanamaPeruPhilippinesPolandPortugalRomaniaRussiaSaudi ArabiaScotlandSenegalSerbiaSierra LeoneSingaporeSomaliaSouth AfricaSouth AmericaSouth Central AsiaSouth Eastern AsiaSouthern EuropeSpainSri LankaSt. Vincent and the GrenadinesSudanSwedenSwitzerlandSyriaTaiwanThailandTrinidad and TobagoTurkeyUgandaUkraineUruguayUzbekistanVenezuelaVietnamWest IndiesWestern AfricaWestern AsiaWestern EuropeYemenZaireZimbabweAzores
Ghanaian
Race
Ancestry
AfghanAfricanAlaska NativeAlaskan AthabascanAlbanianAleutAlsatianAmericanApacheArabArapahoArgentineanArmenianAssyrian/Chaldean/SyriacAustralianAustrianBahamianBangladeshiBarbadianBasqueBelgianBelizeanBermudanBhutaneseBlackfeetBolivianBrazilianBritishBritish West IndianBulgarianBurmeseCajunCambodianCanadianCape VerdeanCarpatho RusynCelticCentral AmericanCentral American IndianCherokeeCheyenneChickasawChileanChineseChippewaChoctawColombianColvilleComancheCosta RicanCreeCreekCroatianCrowCubanCypriotCzechCzechoslovakianDanishDelawareDominicanDutchDutch West IndianEastern EuropeanEcuadorianEgyptianEnglishEstonianEthiopianEuropeanFijianFilipinoFinnishFrenchFrench American IndianFrench CanadianGermanGerman RussianGhanaianGreekGuamanian/ChamorroGuatemalanGuyaneseHaitianHmongHonduranHopiHoumaHungarianIcelanderIndian (Asian)IndonesianInupiatIranianIraqiIrishIroquoisIsraeliItalianJamaicanJapaneseJordanianKenyanKiowaKoreanLaotianLatvianLebaneseLiberianLithuanianLumbeeLuxembourgerMacedonianMalaysianMalteseMarshalleseMenomineeMexicanMexican American IndianMongolianMoroccanNative HawaiianNavajoNepaleseNew ZealanderNicaraguanNigerianNorthern EuropeanNorwegianOkinawanOsageOttawaPaiutePakistaniPalestinianPanamanianParaguayanPennsylvania GermanPeruvianPimaPolishPortuguesePotawatomiPuebloPuerto RicanPuget Sound SalishRomanianRussianSalvadoranSamoanScandinavianScotch-IrishScottishSenegaleseSerbianShoshoneSierra LeoneanSiouxSlavicSlovakSloveneSomaliSouth AfricanSouth AmericanSouth American IndianSoviet UnionSpaniardSpanishSpanish AmericanSpanish American IndianSri LankanSubsaharan AfricanSudaneseSwedishSwissSyrianTaiwaneseThaiTlingit-HaidaTohono O'OdhamTonganTrinidadian and TobagonianTsimshianTurkishU.S. Virgin IslanderUgandanUkrainianUruguayanUteVenezuelanVietnameseWelshWest IndianYakamaYaquiYugoslavianYumanYup'ikZimbabwean
Immigration
NonimmigrantsImmigrantsAfghanistanAfricaAlbaniaArgentinaArmeniaAsiaAustraliaAustriaBahamasBangladeshBarbadosBelarusBelgiumBelizeBoliviaBosnia and HerzegovinaBrazilBulgariaBurma/MyanmarCabo VerdeCambodiaCameroonCanadaCaribbeanCentral AmericaChileChinaColombiaCongoCosta RicaCroatiaCubaCzechoslovakiaDenmarkDominicaDominican RepublicEastern AfricaEastern AsiaEastern EuropeEcuadorEgyptEl SalvadorEnglandEritreaEthiopiaEuropeFijiFranceGermanyGhanaGreeceGrenadaGuatemalaGuyanaHaitiHondurasHong KongHungaryIndiaIndonesiaIranIraqIrelandIsraelItalyJamaicaJapanJordanKazakhstanKenyaKoreaKuwaitLaosLatin AmericaLatviaLebanonLiberiaLithuaniaMalaysiaMexicoMicronesiaMiddle AfricaMoldovaMoroccoNepalNetherlandsNicaraguaNigeriaNorth AmericaNorth MacedoniaNorthern AfricaNorthern EuropeNorwayOceaniaPakistanPanamaPeruPhilippinesPolandPortugalRomaniaRussiaSaudi ArabiaScotlandSenegalSerbiaSierra LeoneSingaporeSomaliaSouth AfricaSouth AmericaSouth Central AsiaSouth Eastern AsiaSouthern EuropeSpainSri LankaSt. Vincent and the GrenadinesSudanSwedenSwitzerlandSyriaTaiwanThailandTrinidad and TobagoTurkeyUgandaUkraineUruguayUzbekistanVenezuelaVietnamWest IndiesWestern AfricaWestern AsiaWestern EuropeYemenZaireZimbabweAzores
7th Grade
Income
Poverty
Unemployment
Labor Participation
Family Structure
Vehicle Availability
Education Level
Disability

7th Grade Comparison

Seminole

Ghanaians

Good
Tragic
96.2%
7TH GRADE
78.1/ 100
METRIC RATING
153rd/ 347
METRIC RANK
95.3%
7TH GRADE
0.7/ 100
METRIC RATING
258th/ 347
METRIC RANK

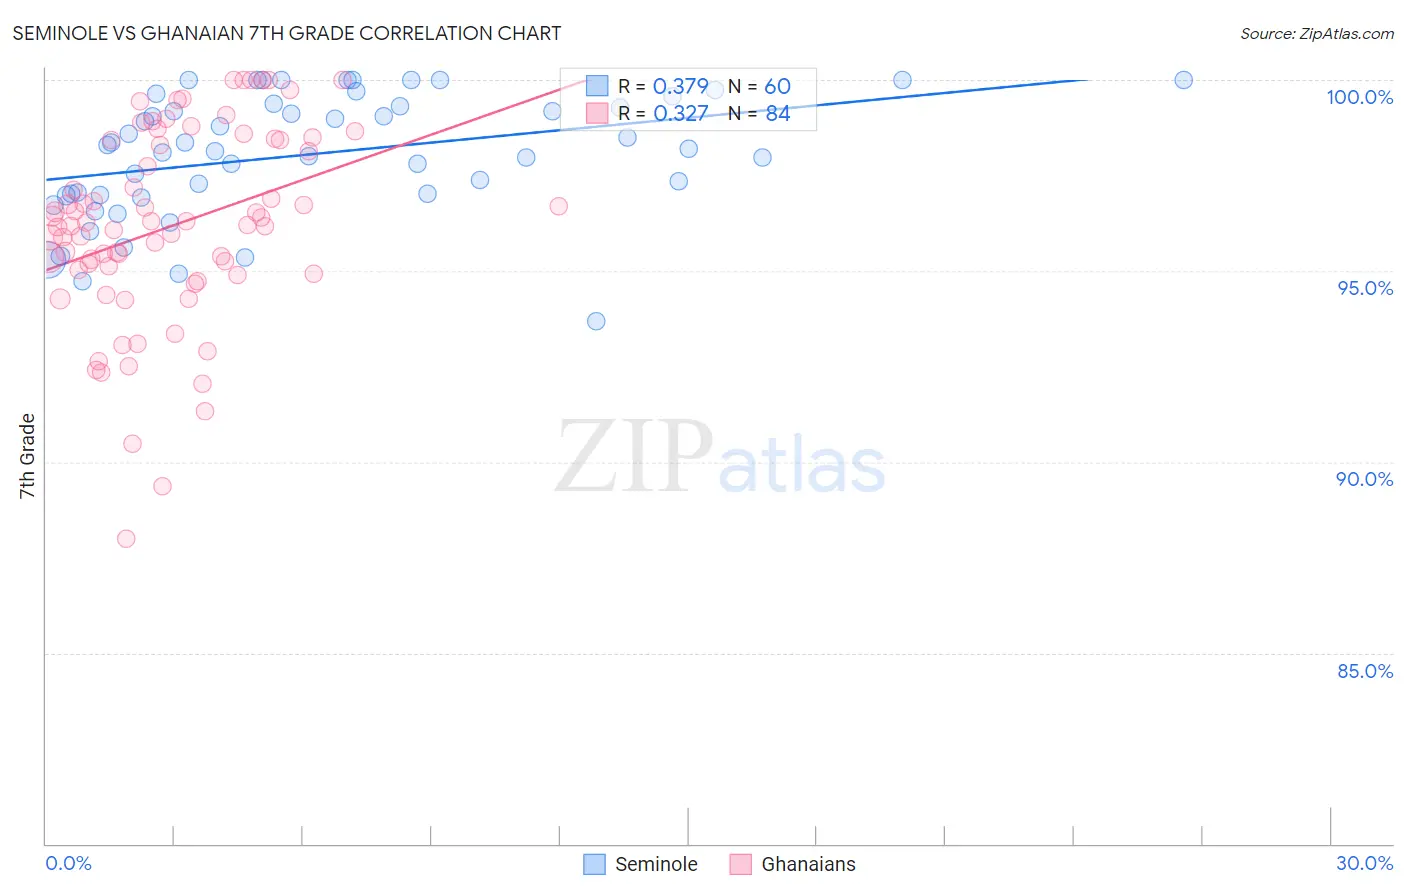
Seminole vs Ghanaian 7th Grade Correlation Chart

The statistical analysis conducted on geographies consisting of 118,314,162 people shows a mild positive correlation between the proportion of Seminole and percentage of population with at least 7th grade education in the United States with a correlation coefficient (R) of 0.379 and weighted average of 96.2%. Similarly, the statistical analysis conducted on geographies consisting of 190,712,873 people shows a mild positive correlation between the proportion of Ghanaians and percentage of population with at least 7th grade education in the United States with a correlation coefficient (R) of 0.327 and weighted average of 95.3%, a difference of 0.96%.
Seminole vs Ghanaian 7th Grade

7th Grade Correlation Summary

MeasurementSeminoleGhanaian
Minimum93.7%88.0%
Maximum100.0%100.0%
Range6.3%12.0%
Mean98.1%96.2%
Median98.3%96.2%
Interquartile 25% (IQ1)97.0%95.0%
Interquartile 75% (IQ3)99.4%98.4%
Interquartile Range (IQR)2.4%3.4%
Standard Deviation (Sample)1.6%2.5%
Standard Deviation (Population)1.6%2.5%

Similar Demographics by 7th Grade

Demographics Similar to Seminole by 7th Grade

In terms of 7th grade, the demographic groups most similar to Seminole are Immigrants from Russia (96.2%, a difference of 0.0%), Immigrants from Israel (96.2%, a difference of 0.0%), Immigrants from Jordan (96.2%, a difference of 0.010%), Kenyan (96.2%, a difference of 0.020%), and Ugandan (96.2%, a difference of 0.020%).
DemographicsRating | Rank7th Grade
Immigrants | Eastern Europe
83.7
/100
|
#146
Excellent
96.3%
French American Indians
83.1
/100
|
#147
Excellent
96.3%
Israelis
82.8
/100
|
#148
Excellent
96.3%
Albanians
82.6
/100
|
#149
Excellent
96.3%
Immigrants | Belarus
82.4
/100
|
#150
Excellent
96.3%
Hopi
81.6
/100
|
#151
Excellent
96.3%
Immigrants | Russia
78.4
/100
|
#152
Good
96.2%
Seminole
78.1
/100
|
#153
Good
96.2%
Immigrants | Israel
77.6
/100
|
#154
Good
96.2%
Immigrants | Jordan
77.0
/100
|
#155
Good
96.2%
Kenyans
76.2
/100
|
#156
Good
96.2%
Ugandans
75.5
/100
|
#157
Good
96.2%
Arabs
68.6
/100
|
#158
Good
96.2%
Alsatians
67.2
/100
|
#159
Good
96.1%
Immigrants | Kenya
66.8
/100
|
#160
Good
96.1%

Demographics Similar to Ghanaians by 7th Grade

In terms of 7th grade, the demographic groups most similar to Ghanaians are Immigrants from China (95.3%, a difference of 0.0%), Immigrants from Congo (95.3%, a difference of 0.0%), Korean (95.3%, a difference of 0.010%), Colombian (95.3%, a difference of 0.020%), and Somali (95.3%, a difference of 0.030%).
DemographicsRating | Rank7th Grade
Immigrants | Jamaica
0.9
/100
|
#251
Tragic
95.4%
Immigrants | Ethiopia
0.9
/100
|
#252
Tragic
95.3%
Somalis
0.9
/100
|
#253
Tragic
95.3%
Colombians
0.8
/100
|
#254
Tragic
95.3%
Koreans
0.8
/100
|
#255
Tragic
95.3%
Immigrants | China
0.7
/100
|
#256
Tragic
95.3%
Immigrants | Congo
0.7
/100
|
#257
Tragic
95.3%
Ghanaians
0.7
/100
|
#258
Tragic
95.3%
Immigrants | Costa Rica
0.6
/100
|
#259
Tragic
95.3%
Afghans
0.5
/100
|
#260
Tragic
95.3%
South Americans
0.5
/100
|
#261
Tragic
95.2%
Immigrants | Somalia
0.5
/100
|
#262
Tragic
95.2%
West Indians
0.5
/100
|
#263
Tragic
95.2%
Immigrants | Nigeria
0.4
/100
|
#264
Tragic
95.2%
Immigrants | Uruguay
0.3
/100
|
#265
Tragic
95.2%