Scottish vs Immigrants from Japan Single Father Households
COMPARE
Scottish
Immigrants from Japan
Single Father Households
Single Father Households Comparison
Scottish
Immigrants from Japan
2.3%
SINGLE FATHER HOUSEHOLDS
72.8/ 100
METRIC RATING
162nd/ 347
METRIC RANK
2.0%
SINGLE FATHER HOUSEHOLDS
100.0/ 100
METRIC RATING
28th/ 347
METRIC RANK
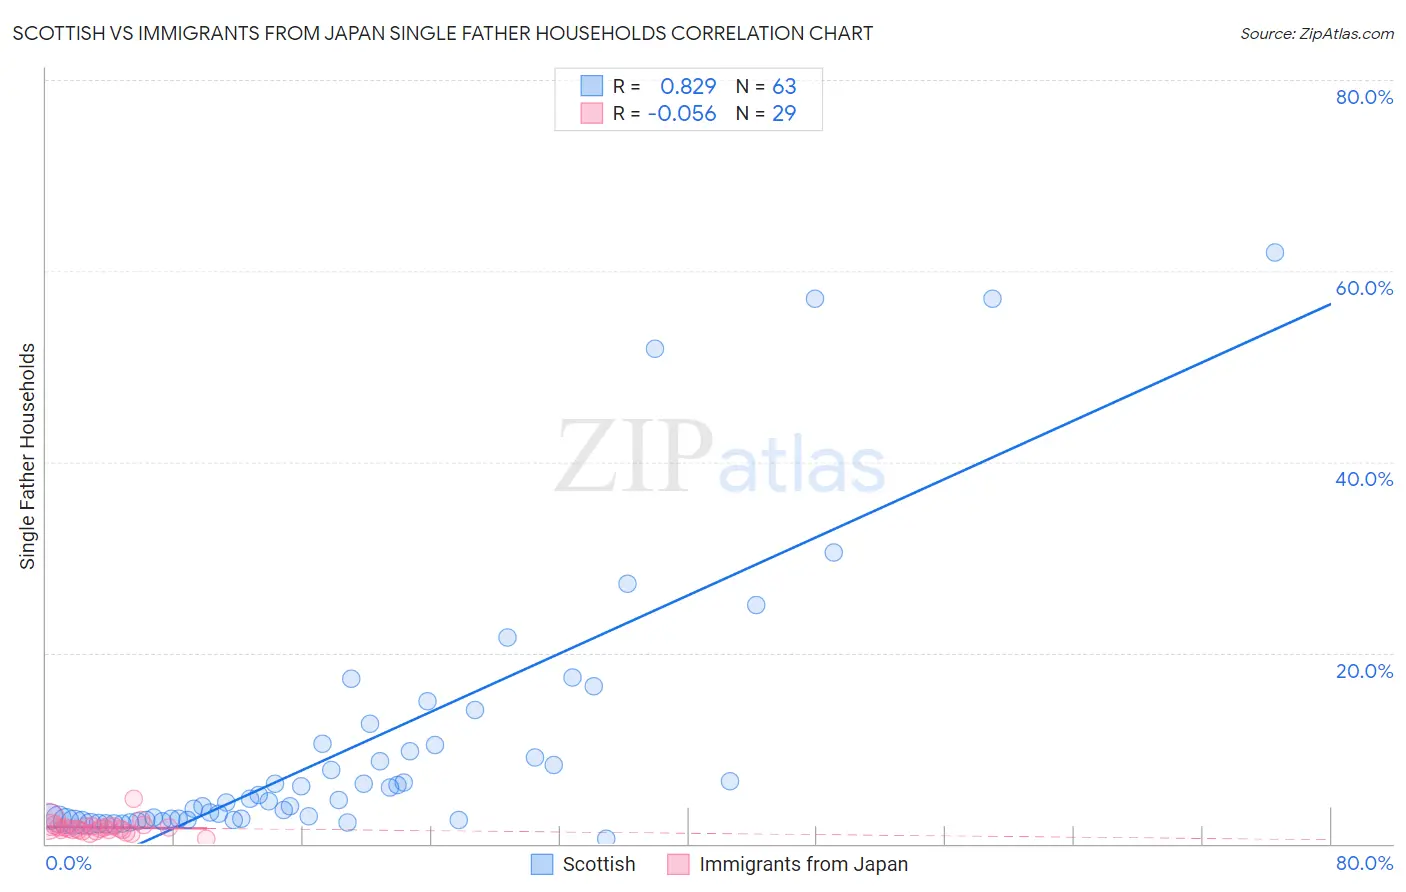
Scottish vs Immigrants from Japan Single Father Households Correlation Chart
The statistical analysis conducted on geographies consisting of 551,948,135 people shows a very strong positive correlation between the proportion of Scottish and percentage of single father households in the United States with a correlation coefficient (R) of 0.829 and weighted average of 2.3%. Similarly, the statistical analysis conducted on geographies consisting of 337,808,657 people shows a slight negative correlation between the proportion of Immigrants from Japan and percentage of single father households in the United States with a correlation coefficient (R) of -0.056 and weighted average of 2.0%, a difference of 16.6%.
Single Father Households Correlation Summary
| Measurement | Scottish | Immigrants from Japan |
| Minimum | 0.58% | 0.57% |
| Maximum | 61.9% | 4.8% |
| Range | 61.3% | 4.2% |
| Mean | 10.1% | 1.7% |
| Median | 4.4% | 1.6% |
| Interquartile 25% (IQ1) | 2.5% | 1.4% |
| Interquartile 75% (IQ3) | 10.3% | 1.9% |
| Interquartile Range (IQR) | 7.8% | 0.46% |
| Standard Deviation (Sample) | 14.0% | 0.70% |
| Standard Deviation (Population) | 13.8% | 0.69% |
Similar Demographics by Single Father Households
Demographics Similar to Scottish by Single Father Households
In terms of single father households, the demographic groups most similar to Scottish are Swiss (2.3%, a difference of 0.030%), Irish (2.3%, a difference of 0.070%), Pakistani (2.3%, a difference of 0.21%), Scotch-Irish (2.3%, a difference of 0.31%), and Immigrants from Bolivia (2.3%, a difference of 0.34%).
| Demographics | Rating | Rank | Single Father Households |
| Europeans | 80.9 /100 | #155 | Excellent 2.3% |
| Immigrants | South America | 79.9 /100 | #156 | Good 2.3% |
| Canadians | 79.7 /100 | #157 | Good 2.3% |
| Immigrants | Senegal | 79.4 /100 | #158 | Good 2.3% |
| Immigrants | West Indies | 77.9 /100 | #159 | Good 2.3% |
| Immigrants | Bolivia | 76.3 /100 | #160 | Good 2.3% |
| Swiss | 73.2 /100 | #161 | Good 2.3% |
| Scottish | 72.8 /100 | #162 | Good 2.3% |
| Irish | 72.1 /100 | #163 | Good 2.3% |
| Pakistanis | 70.6 /100 | #164 | Good 2.3% |
| Scotch-Irish | 69.4 /100 | #165 | Good 2.3% |
| English | 68.6 /100 | #166 | Good 2.3% |
| South Americans | 64.3 /100 | #167 | Good 2.3% |
| Icelanders | 63.1 /100 | #168 | Good 2.3% |
| Czechs | 62.5 /100 | #169 | Good 2.3% |
Demographics Similar to Immigrants from Japan by Single Father Households
In terms of single father households, the demographic groups most similar to Immigrants from Japan are Bulgarian (2.0%, a difference of 0.090%), Cambodian (2.0%, a difference of 0.11%), Israeli (2.0%, a difference of 0.14%), Immigrants from South Central Asia (2.0%, a difference of 0.18%), and Chinese (2.0%, a difference of 0.18%).
| Demographics | Rating | Rank | Single Father Households |
| Immigrants | Albania | 100.0 /100 | #21 | Exceptional 1.9% |
| Immigrants | Latvia | 100.0 /100 | #22 | Exceptional 1.9% |
| Immigrants | Croatia | 100.0 /100 | #23 | Exceptional 2.0% |
| Immigrants | Russia | 100.0 /100 | #24 | Exceptional 2.0% |
| Eastern Europeans | 100.0 /100 | #25 | Exceptional 2.0% |
| Assyrians/Chaldeans/Syriacs | 100.0 /100 | #26 | Exceptional 2.0% |
| Immigrants | South Central Asia | 100.0 /100 | #27 | Exceptional 2.0% |
| Immigrants | Japan | 100.0 /100 | #28 | Exceptional 2.0% |
| Bulgarians | 100.0 /100 | #29 | Exceptional 2.0% |
| Cambodians | 100.0 /100 | #30 | Exceptional 2.0% |
| Israelis | 100.0 /100 | #31 | Exceptional 2.0% |
| Chinese | 100.0 /100 | #32 | Exceptional 2.0% |
| Turks | 100.0 /100 | #33 | Exceptional 2.0% |
| Immigrants | Australia | 100.0 /100 | #34 | Exceptional 2.0% |
| Albanians | 100.0 /100 | #35 | Exceptional 2.0% |